Acriflavine Resistance Protein B
(All numbering and residues are taken from first PDB file)
![]()
![]()
Bending Residue Dihedral Analysis
Residue
iResidue
i+1Distance of hinge axis to residue i in
(A) Distance of hinge axis to residue i in
(A) Change in
(deg) Change in
(deg) Angle of psi(i) axis to hinge axis
(deg) Angle of psi(i) axis to hinge axis
(deg) Percentage Progress
TYR-35
PRO-36
16.1
16.9
-11.2
-9.5
59.4
57.2
37.4
PRO-36
THR-37
13.4
14.1
30.9
-6.2
41.9
51.3
101.1
THR-37
ILE-38
10.3
10.9
-11.7
2.4
104.1
103.1
18.1

Graph shows rotational transition at bending residues and can be used
to identify hinge bending residues.
Probably only informative for interdomain rotations greater than 20 degrees
Residue
iResidue
i+1Distance of hinge axis to residue i in
(A) Distance of hinge axis to residue i in
(A) Change in
(deg) Change in
(deg) Angle of psi(i) axis to hinge axis
(deg) Angle of psi(i) axis to hinge axis
(deg) Percentage Progress
SER-128
VAL-129
9.9
9.2
6.9
-6.5
66.2
63.1
-63.4
VAL-129
GLU-130
8.0
7.6
-1.7
-18.5
128.7
127.0
-36.3
GLU-130
LYS-131
5.0
4.4
-14.5
59.9
118.5
100.3
49.6
LYS-131
SER-132
2.1
1.2
47.2
6.2
93.9
131.6
-107.8
SER-132
SER-133
2.8
1.4
-3.5
-26.5
82.2
105.1
17.7
SER-133
SER-134
5.2
5.2
50.8
-74.2
177.7
151.5
88.0
SER-134
SER-135
6.0
6.8
18.5
-58.8
112.4
120.1
69.1
SER-135
PHE-136
9.4
9.9
4.8
-7.7
70.2
62.2
-24.1

Graph shows rotational transition at bending residues and can be used
to identify hinge bending residues.
Probably only informative for interdomain rotations greater than 20 degrees
Residue
iResidue
i+1Distance of hinge axis to residue i in
(A) Distance of hinge axis to residue i in
(A) Change in
(deg) Change in
(deg) Angle of psi(i) axis to hinge axis
(deg) Angle of psi(i) axis to hinge axis
(deg) Percentage Progress
VAL-576
GLN-577
13.6
14.1
15.9
-27.6
72.8
73.8
-69.8
GLN-577
LEU-578
11.0
11.5
-14.5
30.1
173.5
163.3
88.1
LEU-578
PRO-579
10.0
11.3
5.6
29.9
73.6
73.0
-6.2

Graph shows rotational transition at bending residues and can be used
to identify hinge bending residues.
Probably only informative for interdomain rotations greater than 20 degrees
Residue
iResidue
i+1Distance of hinge axis to residue i in
(A) Distance of hinge axis to residue i in
(A) Change in
(deg) Change in
(deg) Angle of psi(i) axis to hinge axis
(deg) Angle of psi(i) axis to hinge axis
(deg) Percentage Progress
GLY-581
ALA-582
3.2
3.9
35.4
-11.2
100.6
101.8
-42.3
ALA-582
THR-583
6.9
7.3
-5.2
11.7
109.4
112.6
-2.0
THR-583
GLN-584
8.9
8.8
13.0
-12.1
44.3
43.8
31.1

Graph shows rotational transition at bending residues and can be used
to identify hinge bending residues.
Probably only informative for interdomain rotations greater than 20 degrees
Residue
iResidue
i+1Distance of hinge axis to residue i in
(A) Distance of hinge axis to residue i in
(A) Change in
(deg) Change in
(deg) Angle of psi(i) axis to hinge axis
(deg) Angle of psi(i) axis to hinge axis
(deg) Percentage Progress
GLY-614
PHE-615
9.8
9.6
-0.4
10.6
36.7
33.5
-39.2
PHE-615
GLY-616
8.9
8.9
34.7
-51.9
91.3
91.2
40.3
GLY-616
PHE-617
8.0
8.6
15.6
-32.7
152.4
141.9
90.6
PHE-617
ALA-618
7.5
8.2
11.0
-11.4
85.1
65.3
-21.8
ALA-618
GLY-619
5.5
7.9
25.1
-35.2
86.6
75.3
-4.1
GLY-619
ARG-620
2.8
4.2
-33.5
35.6
120.0
112.8
13.5
ARG-620
GLY-621
4.5
3.7
31.8
-65.0
17.2
1.2
-154.5
GLY-621
GLN-622
4.8
4.6
-13.8
12.1
117.9
111.2
41.2

Graph shows rotational transition at bending residues and can be used
to identify hinge bending residues.
Probably only informative for interdomain rotations greater than 20 degrees
Residue
iResidue
i+1Distance of hinge axis to residue i in
(A) Distance of hinge axis to residue i in
(A) Change in
(deg) Change in
(deg) Angle of psi(i) axis to hinge axis
(deg) Angle of psi(i) axis to hinge axis
(deg) Percentage Progress
ASN-667
LEU-668
20.9
21.4
42.7
-35.8
122.5
116.4
-3.9
LEU-668
PRO-669
17.8
18.4
25.3
-15.3
137.0
130.1
-37.1
PRO-669
ALA-670
18.6
17.7
24.8
-22.2
160.1
158.9
-17.5
ALA-670
ILE-671
19.7
18.6
1.2
-15.6
119.7
120.4
25.0
ILE-671
VAL-672
17.4
15.2
7.6
-7.2
58.9
44.5
-13.5
VAL-672
GLU-673
14.3
13.6
-157.4
-130.2
96.1
100.6
40.5
GLU-673
LEU-674
12.1
10.0
-58.0
81.5
65.2
104.8
55.7
LEU-674
GLY-675
14.8
11.2
-156.7
173.2
100.1
166.3
150.9
GLY-675
THR-676
18.1
13.2
44.6
-7.0
60.7
69.4
169.3
THR-676
ALA-677
20.3
13.0
-157.5
-133.8
87.1
112.7
-61.0
ALA-677
THR-678
24.2
16.5
-117.6
68.6
96.4
58.9
127.2
THR-678
GLY-679
24.8
20.0
92.8
-173.2
47.4
74.3
-259.9
GLY-679
PHE-680
21.6
21.4
51.7
50.4
109.6
91.1
-38.4
PHE-680
ASP-681
20.3
20.3
-16.1
7.2
116.5
121.7
17.2
ASP-681
PHE-682
17.3
17.1
21.1
-10.9
78.8
88.5
41.3
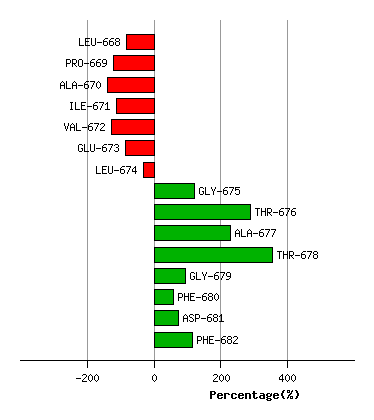
Graph shows rotational transition at bending residues and can be used
to identify hinge bending residues.
Probably only informative for interdomain rotations greater than 20 degrees
Residue
iResidue
i+1Distance of hinge axis to residue i in
(A) Distance of hinge axis to residue i in
(A) Change in
(deg) Change in
(deg) Angle of psi(i) axis to hinge axis
(deg) Angle of psi(i) axis to hinge axis
(deg) Percentage Progress
THR-724
PRO-725
5.1
4.4
-4.6
-1.2
54.4
47.2
37.8
PRO-725
GLN-726
4.7
4.2
28.6
-18.4
69.0
68.2
40.2
GLN-726
PHE-727
6.0
5.8
-40.4
24.1
38.0
39.8
71.1

Graph shows rotational transition at bending residues and can be used
to identify hinge bending residues.
Probably only informative for interdomain rotations greater than 20 degrees
Residue
iResidue
i+1Distance of hinge axis to residue i in
(A) Distance of hinge axis to residue i in
(A) Change in
(deg) Change in
(deg) Angle of psi(i) axis to hinge axis
(deg) Angle of psi(i) axis to hinge axis
(deg) Percentage Progress
GLU-810
TYR-811
9.3
9.4
6.5
-29.7
139.6
121.7
111.7
TYR-811
GLY-812
9.0
9.2
37.7
-69.8
150.4
161.6
130.8
GLY-812
SER-813
8.9
9.3
-2.8
-0.1
45.8
58.1
5.4
SER-813
PRO-814
8.0
7.5
31.9
-15.9
115.3
114.2
-32.3
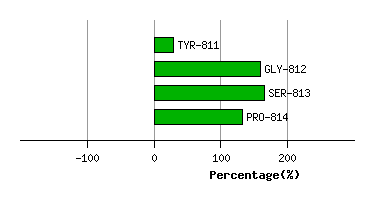
Graph shows rotational transition at bending residues and can be used
to identify hinge bending residues.
Probably only informative for interdomain rotations greater than 20 degrees
Residue
iResidue
i+1Distance of hinge axis to residue i in
(A) Distance of hinge axis to residue i in
(A) Change in
(deg) Change in
(deg) Angle of psi(i) axis to hinge axis
(deg) Angle of psi(i) axis to hinge axis
(deg) Percentage Progress
GLU-866
ARG-867
21.5
22.1
-9.3
12.9
92.0
97.9
-8.9
ARG-867
LEU-868
23.1
23.6
-21.7
13.6
147.3
162.9
-41.2
LEU-868
SER-869
21.5
22.4
-8.1
87.7
141.7
124.2
271.8
SER-869
GLY-870
22.8
23.8
179.2
121.3
107.7
93.2
60.7
GLY-870
ASN-871
26.1
27.2
141.5
-133.4
66.1
63.6
79.8
ASN-871
GLN-872
29.7
27.5
-53.5
18.8
176.6
174.4
-189.4
GLN-872
ALA-873
28.5
26.3
-14.6
10.1
119.5
118.4
-48.9

Graph shows rotational transition at bending residues and can be used
to identify hinge bending residues.
Probably only informative for interdomain rotations greater than 20 degrees