Serum Albumin
(All numbering and residues are taken from first PDB file)
![]()
![]()
Bending Residue Dihedral Analysis
Residue
iResidue
i+1Distance of hinge axis to residue i in
(A) Distance of hinge axis to residue i in
(A) Change in
(deg) Change in
(deg) Angle of psi(i) axis to hinge axis
(deg) Angle of psi(i) axis to hinge axis
(deg) Percentage Progress
GLN-390
ASN-391
9.3
10.2
-10.1
1.8
65.2
58.1
7.6
ASN-391
CYS-392
7.4
8.4
-8.4
7.0
14.0
14.7
-0.9
CYS-392
GLU-393
8.1
9.1
-31.1
32.3
85.2
84.0
1.7
GLU-393
LEU-394
11.8
12.8
-2.5
0.1
83.4
82.9
-6.3
GLU-393
LEU-394
11.8
12.8
-2.5
0.1
83.4
82.9
-6.3

Graph shows rotational transition at bending residues and can be used
to identify hinge bending residues.
Probably only informative for interdomain rotations greater than 20 degrees
Residue
iResidue
i+1Distance of hinge axis to residue i in
(A) Distance of hinge axis to residue i in
(A) Change in
(deg) Change in
(deg) Angle of psi(i) axis to hinge axis
(deg) Angle of psi(i) axis to hinge axis
(deg) Percentage Progress
GLU-393
LEU-394
11.8
12.8
-2.5
0.1
83.4
82.9
-6.3
GLU-393
LEU-394
11.8
12.8
-2.5
0.1
83.4
82.9
-6.3
LEU-394
PHE-395
12.3
13.3
23.4
-21.3
35.9
41.9
-3.5
PHE-395
GLU-396
10.9
11.9
17.1
-10.8
40.9
41.3
15.4

Graph shows rotational transition at bending residues and can be used
to identify hinge bending residues.
Probably only informative for interdomain rotations greater than 20 degrees
Residue
iResidue
i+1Distance of hinge axis to residue i in
(A) Distance of hinge axis to residue i in
(A) Change in
(deg) Change in
(deg) Angle of psi(i) axis to hinge axis
(deg) Angle of psi(i) axis to hinge axis
(deg) Percentage Progress
TYR-401
LYS-402
16.0
16.7
-3.9
7.0
158.8
152.1
5.8
LYS-402
PHE-403
16.6
17.7
3.2
-8.8
56.7
48.2
-23.2
PHE-403
GLN-404
12.9
14.2
13.6
-5.0
67.9
62.6
19.2
GLN-404
ASN-405
13.2
14.2
-7.1
12.2
143.2
145.3
23.7

Graph shows rotational transition at bending residues and can be used
to identify hinge bending residues.
Probably only informative for interdomain rotations greater than 20 degrees
Residue
iResidue
i+1Distance of hinge axis to residue i in
(A) Distance of hinge axis to residue i in
(A) Change in
(deg) Change in
(deg) Angle of psi(i) axis to hinge axis
(deg) Angle of psi(i) axis to hinge axis
(deg) Percentage Progress
CYS-437
CYS-438
1.9
2.4
-18.1
-5.6
85.4
87.3
4.4
CYS-438
LYS-439
5.6
6.0
3.5
24.0
39.9
27.6
112.4
LYS-439
HIS-440
6.7
6.8
-32.0
14.7
104.2
107.1
-26.2

Graph shows rotational transition at bending residues and can be used
to identify hinge bending residues.
Probably only informative for interdomain rotations greater than 20 degrees
Residue
iResidue
i+1Distance of hinge axis to residue i in
(A) Distance of hinge axis to residue i in
(A) Change in
(deg) Change in
(deg) Angle of psi(i) axis to hinge axis
(deg) Angle of psi(i) axis to hinge axis
(deg) Percentage Progress
MET-446
PRO-447
6.3
5.5
-6.1
12.2
74.5
63.0
-31.2
PRO-447
CYS-448
7.4
6.8
-6.6
-3.1
71.4
71.9
15.4
CYS-448
ALA-449
4.2
3.4
2.6
20.3
44.8
41.3
57.5
ALA-449
GLU-450
1.9
1.7
3.0
7.2
42.6
71.2
-2.9
GLU-450
ASP-451
4.2
5.3
0.7
1.8
102.9
122.9
-14.6
ASP-451
TYR-452
7.3
6.9
-7.6
-12.6
73.9
91.8
-2.6
TYR-452
LEU-453
6.2
6.1
-19.2
22.0
144.4
158.1
27.3
LEU-453
SER-454
5.9
5.8
-8.2
3.7
117.0
112.7
-12.9

Graph shows rotational transition at bending residues and can be used
to identify hinge bending residues.
Probably only informative for interdomain rotations greater than 20 degrees
Residue
iResidue
i+1Distance of hinge axis to residue i in
(A) Distance of hinge axis to residue i in
(A) Change in
(deg) Change in
(deg) Angle of psi(i) axis to hinge axis
(deg) Angle of psi(i) axis to hinge axis
(deg) Percentage Progress
LYS-475
CYS-476
13.8
12.9
9.8
-4.8
42.7
39.2
21.2
CYS-476
CYS-477
11.2
10.8
-24.6
22.4
140.4
131.9
-20.4
CYS-477
THR-478
14.1
13.6
34.5
-17.4
99.8
101.9
15.0
THR-478
GLU-479
16.6
15.7
1.4
-10.9
113.7
94.5
26.4
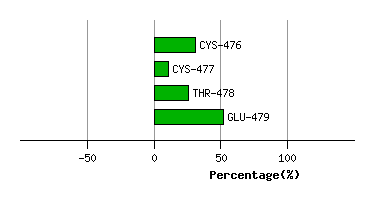
Graph shows rotational transition at bending residues and can be used
to identify hinge bending residues.
Probably only informative for interdomain rotations greater than 20 degrees
Residue
iResidue
i+1Distance of hinge axis to residue i in
(A) Distance of hinge axis to residue i in
(A) Change in
(deg) Change in
(deg) Angle of psi(i) axis to hinge axis
(deg) Angle of psi(i) axis to hinge axis
(deg) Percentage Progress
SER-480
LEU-481
14.4
14.6
39.1
-10.9
23.5
40.4
113.4
LEU-481
VAL-482
14.4
13.1
17.0
4.9
70.2
93.7
27.4
VAL-482
ASN-483
12.5
11.6
-27.9
29.8
62.7
56.5
-1.0
ASN-483
ARG-484
9.8
9.4
-45.4
26.9
87.3
105.4
-6.8
ARG-484
ARG-485
9.3
9.1
-22.9
9.8
96.7
97.2
1.8
ARG-485
PRO-486
5.8
5.7
6.6
-4.9
142.1
141.3
-3.5
PRO-486
CYS-487
4.4
4.3
-0.7
5.3
40.3
45.5
-14.8

Graph shows rotational transition at bending residues and can be used
to identify hinge bending residues.
Probably only informative for interdomain rotations greater than 20 degrees