Elongation Factor Tu
(All numbering and residues are taken from first PDB file)
![]()
![]()
Bending Residue Dihedral Analysis
Residue
iResidue
i+1Distance of hinge axis to residue i in
(A) Distance of hinge axis to residue i in
(A) Change in
(deg) Change in
(deg) Angle of psi(i) axis to hinge axis
(deg) Angle of psi(i) axis to hinge axis
(deg) Percentage Progress
THR-212
PRO-213
3.9
4.1
0.4
2.4
67.8
69.1
21.8
PRO-213
VAL-214
4.1
4.2
-3.0
-20.3
64.4
59.3
62.1
VAL-214
ARG-215
7.1
6.8
-28.5
47.8
134.2
141.8
64.5
ARG-215
ASP-216
9.9
9.3
-11.6
8.0
85.7
91.5
15.8
ASP-216
VAL-217
13.2
11.5
3.3
-9.8
81.4
67.0
-16.9
VAL-217
ASP-218
15.9
14.8
-10.1
29.0
92.0
92.2
3.9
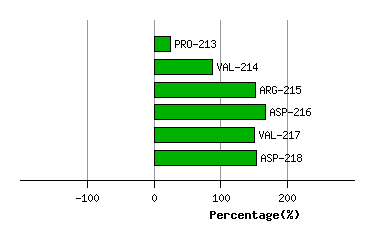
Graph shows rotational transition at bending residues and can be used
to identify hinge bending residues.
Probably only informative for interdomain rotations greater than 20 degrees
Residue
iResidue
i+1Distance of hinge axis to residue i in
(A) Distance of hinge axis to residue i in
(A) Change in
(deg) Change in
(deg) Angle of psi(i) axis to hinge axis
(deg) Angle of psi(i) axis to hinge axis
(deg) Percentage Progress
LEU-323
LYS-324
12.3
11.7
1.3
-0.7
131.7
124.3
-15.3
LYS-324
LYS-325
15.7
15.0
3.5
-6.3
107.6
97.7
5.4
LYS-325
GLU-326
16.4
15.5
3.7
-9.5
44.1
33.4
-45.1
GLU-326
GLU-327
18.4
17.2
13.4
-4.6
47.7
47.6
31.6
GLU-327
GLY-328
15.3
13.8
-22.1
24.6
64.0
69.8
-9.5
GLY-328
GLY-329
13.9
12.1
-3.0
-10.4
55.8
37.8
53.2
GLY-329
ARG-330
12.0
11.2
20.9
-51.2
168.5
147.4
187.3
ARG-330
HIS-331
12.0
12.8
5.6
18.0
103.3
94.2
-55.5
HIS-331
THR-332
15.2
16.2
4.6
3.4
116.4
117.0
-33.4
THR-332
GLY-333
14.4
14.9
-12.1
-4.1
110.7
108.4
-27.9
GLY-333
PHE-334
13.4
13.1
33.4
-14.6
120.1
133.0
-57.8
PHE-334
PHE-335
10.7
10.9
0.1
2.7
103.3
109.8
1.9
PHE-335
SER-336
11.3
11.5
-1.3
0.7
104.6
94.9
32.0
SER-336
GLY-337
11.6
11.4
19.3
-16.2
123.3
126.5
-30.7
GLY-337
TYR-338
8.7
8.4
0.9
-5.9
71.0
67.2
-5.5

Graph shows rotational transition at bending residues and can be used
to identify hinge bending residues.
Probably only informative for interdomain rotations greater than 20 degrees
Residue
iResidue
i+1Distance of hinge axis to residue i in
(A) Distance of hinge axis to residue i in
(A) Change in
(deg) Change in
(deg) Angle of psi(i) axis to hinge axis
(deg) Angle of psi(i) axis to hinge axis
(deg) Percentage Progress
GLN-341
PHE-342
2.0
1.9
-0.3
0.5
149.8
149.1
-2.2
PHE-342
TYR-343
3.1
3.4
-10.1
12.9
134.9
133.8
41.5
TYR-343
PHE-344
3.2
3.4
-7.1
2.8
143.2
138.8
-23.8
PHE-344
ARG-345
5.4
6.1
-3.3
0.6
124.2
123.4
0.6
ARG-345
THR-346
6.0
6.8
-5.6
8.0
60.7
61.2
-12.0
THR-346
THR-347
8.6
9.0
-3.7
5.9
18.2
9.5
-29.0
THR-347
ASP-348
8.6
8.8
2.4
-4.9
128.5
121.0
6.4
ASP-348
VAL-349
6.9
6.7
-14.5
11.9
35.9
30.4
46.9
VAL-349
THR-350
7.3
7.1
-2.7
3.4
52.6
54.6
-8.4
THR-350
GLY-351
5.8
5.5
4.9
-10.3
88.5
91.5
-5.2

Graph shows rotational transition at bending residues and can be used
to identify hinge bending residues.
Probably only informative for interdomain rotations greater than 20 degrees
Residue
iResidue
i+1Distance of hinge axis to residue i in
(A) Distance of hinge axis to residue i in
(A) Change in
(deg) Change in
(deg) Angle of psi(i) axis to hinge axis
(deg) Angle of psi(i) axis to hinge axis
(deg) Percentage Progress
LYS-376
PRO-377
13.5
13.2
2.2
2.9
31.2
32.3
21.2
PRO-377
VAL-378
15.2
14.8
5.9
4.9
39.3
38.5
69.3
VAL-378
ALA-379
13.5
13.1
-9.3
3.6
143.0
140.3
-41.8
ALA-379
LEU-380
14.1
14.3
-6.0
-1.5
98.6
102.6
-21.5
LEU-380
GLU-381
12.8
13.3
-8.6
5.2
135.7
125.4
-21.6

Graph shows rotational transition at bending residues and can be used
to identify hinge bending residues.
Probably only informative for interdomain rotations greater than 20 degrees
Residue
iResidue
i+1Distance of hinge axis to residue i in
(A) Distance of hinge axis to residue i in
(A) Change in
(deg) Change in
(deg) Angle of psi(i) axis to hinge axis
(deg) Angle of psi(i) axis to hinge axis
(deg) Percentage Progress
GLY-392
ARG-393
9.1
9.0
2.8
8.3
46.9
51.6
58.4
ARG-393
THR-394
8.7
8.5
-4.9
-6.9
116.5
115.8
-31.1
THR-394
VAL-395
6.8
6.5
-19.6
18.7
68.0
70.0
12.2
VAL-395
GLY-396
7.5
7.4
2.1
8.0
57.0
61.1
21.0
GLY-396
ALA-397
7.5
7.2
-12.0
14.0
143.6
148.6
2.4
ALA-397
GLY-398
6.8
6.8
-19.0
21.6
95.5
90.3
-19.7
GLY-398
VAL-399
8.2
8.0
-6.5
-5.2
134.3
135.9
-54.2

Graph shows rotational transition at bending residues and can be used
to identify hinge bending residues.
Probably only informative for interdomain rotations greater than 20 degrees