Glutamate Receptor Subunit 2
(All numbering and residues are taken from first PDB file)
![]()
![]()
Bending Residue Dihedral Analysis
Residue
iResidue
i+1Distance of hinge axis to residue i in
(A) Distance of hinge axis to residue i in
(A) Change in
(deg) Change in
(deg) Angle of psi(i) axis to hinge axis
(deg) Angle of psi(i) axis to hinge axis
(deg) Percentage Progress
SER-108
LEU-109
4.2
4.3
-8.3
4.9
12.9
15.5
-14.4
LEU-109
GLY-110
5.5
5.6
1.7
13.9
94.5
97.6
36.6
GLY-110
ILE-111
8.4
8.6
5.6
-13.5
166.4
171.4
102.2
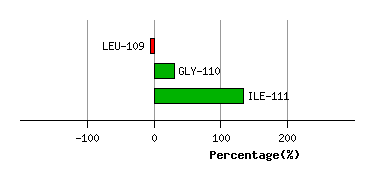
Graph shows rotational transition at bending residues and can be used
to identify hinge bending residues.
Probably only informative for interdomain rotations greater than 20 degrees
Residue
iResidue
i+1Distance of hinge axis to residue i in
(A) Distance of hinge axis to residue i in
(A) Change in
(deg) Change in
(deg) Angle of psi(i) axis to hinge axis
(deg) Angle of psi(i) axis to hinge axis
(deg) Percentage Progress
MET-196
ASN-197
4.6
4.9
3.2
3.4
54.4
50.9
49.6
ASN-197
GLU-198
2.3
2.7
4.9
-9.0
95.9
92.6
0.7
GLU-198
TYR-199
1.2
0.8
7.2
-4.9
73.6
75.2
-6.7
TYR-199
ILE-200
3.8
3.9
3.3
-3.7
9.7
7.5
2.3

Graph shows rotational transition at bending residues and can be used
to identify hinge bending residues.
Probably only informative for interdomain rotations greater than 20 degrees
Residue
iResidue
i+1Distance of hinge axis to residue i in
(A) Distance of hinge axis to residue i in
(A) Change in
(deg) Change in
(deg) Angle of psi(i) axis to hinge axis
(deg) Angle of psi(i) axis to hinge axis
(deg) Percentage Progress
LYS-204
PRO-205
7.7
7.5
-0.9
-25.6
61.7
57.8
74.7
PRO-205
CYS-206
6.2
6.5
33.3
-9.0
58.1
63.3
88.6
CYS-206
ASP-207
6.1
5.9
2.1
3.0
111.6
113.2
-34.2
ASP-207
THR-208
4.7
4.3
-7.8
6.3
121.7
123.4
11.1
THR-208
MET-209
3.6
3.1
-1.9
-3.0
36.8
35.7
-18.9
THR-208
MET-209
3.6
3.1
-1.9
-3.0
36.8
35.7
-18.9

Graph shows rotational transition at bending residues and can be used
to identify hinge bending residues.
Probably only informative for interdomain rotations greater than 20 degrees
Residue
iResidue
i+1Distance of hinge axis to residue i in
(A) Distance of hinge axis to residue i in
(A) Change in
(deg) Change in
(deg) Angle of psi(i) axis to hinge axis
(deg) Angle of psi(i) axis to hinge axis
(deg) Percentage Progress
THR-208
MET-209
3.6
3.1
-1.9
-3.0
36.8
35.7
-18.9
THR-208
MET-209
3.6
3.1
-1.9
-3.0
36.8
35.7
-18.9
MET-209
LYS-210
5.9
5.4
-2.2
4.0
51.4
50.6
68.6
LYS-210
VAL-211
6.0
5.7
0.6
0.7
104.6
100.5
-45.9
VAL-211
GLY-212
9.7
9.5
5.0
-7.9
48.3
48.3
-41.1
VAL-211
GLY-212
9.7
9.5
5.0
-7.9
48.3
48.3
-41.1

Graph shows rotational transition at bending residues and can be used
to identify hinge bending residues.
Probably only informative for interdomain rotations greater than 20 degrees
Residue
iResidue
i+1Distance of hinge axis to residue i in
(A) Distance of hinge axis to residue i in
(A) Change in
(deg) Change in
(deg) Angle of psi(i) axis to hinge axis
(deg) Angle of psi(i) axis to hinge axis
(deg) Percentage Progress
VAL-211
GLY-212
9.7
9.5
5.0
-7.9
48.3
48.3
-41.1
VAL-211
GLY-212
9.7
9.5
5.0
-7.9
48.3
48.3
-41.1
GLY-212
GLY-213
11.8
11.9
1.3
6.0
33.8
32.0
30.2
GLY-213
ASN-214
11.1
11.4
-1.3
-4.3
84.9
83.1
16.7
ASN-214
LEU-215
9.9
10.3
3.5
2.9
79.5
81.0
-13.8
LEU-215
ASP-216
13.1
13.5
-8.5
10.3
143.3
148.3
-1.7
ASP-216
SER-217
12.6
13.0
-2.9
6.3
116.5
117.3
5.6
SER-217
LYS-218
10.1
10.6
-3.7
5.1
100.6
106.7
-30.8

Graph shows rotational transition at bending residues and can be used
to identify hinge bending residues.
Probably only informative for interdomain rotations greater than 20 degrees