Acrb
(All numbering and residues are taken from first PDB file)
![]()
![]()
Bending Residue Dihedral Analysis
Residue
iResidue
i+1Distance of hinge axis to residue i in
(A) Distance of hinge axis to residue i in
(A) Change in
(deg) Change in
(deg) Angle of psi(i) axis to hinge axis
(deg) Angle of psi(i) axis to hinge axis
(deg) Percentage Progress
PRO-36
THR-37
18.3
18.9
-47.7
-1.7
56.6
46.9
214.3
THR-37
ILE-38
15.9
16.4
26.5
-28.4
110.7
103.7
110.3
ILE-38
ALA-39
18.5
18.3
49.5
-32.8
128.3
133.4
-122.4

Graph shows rotational transition at bending residues and can be used
to identify hinge bending residues.
Probably only informative for interdomain rotations greater than 20 degrees
Residue
iResidue
i+1Distance of hinge axis to residue i in
(A) Distance of hinge axis to residue i in
(A) Change in
(deg) Change in
(deg) Angle of psi(i) axis to hinge axis
(deg) Angle of psi(i) axis to hinge axis
(deg) Percentage Progress
SER-135
PHE-136
11.4
11.3
2.8
-6.7
119.4
111.9
71.0
PHE-136
LEU-137
10.8
10.5
-28.6
36.6
58.7
40.3
-55.4
LEU-137
MET-138
13.3
11.8
-28.9
-4.6
115.6
110.8
-98.7

Graph shows rotational transition at bending residues and can be used
to identify hinge bending residues.
Probably only informative for interdomain rotations greater than 20 degrees
Residue
iResidue
i+1Distance of hinge axis to residue i in
(A) Distance of hinge axis to residue i in
(A) Change in
(deg) Change in
(deg) Angle of psi(i) axis to hinge axis
(deg) Angle of psi(i) axis to hinge axis
(deg) Percentage Progress
GLU-152
ASP-153
16.6
16.7
-83.3
65.0
110.3
137.2
-136.7
ASP-153
ILE-154
19.7
19.7
42.7
-27.0
20.9
31.8
107.2
ILE-154
SER-155
19.2
18.2
-18.5
19.2
115.1
117.3
68.6
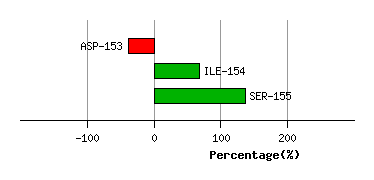
Graph shows rotational transition at bending residues and can be used
to identify hinge bending residues.
Probably only informative for interdomain rotations greater than 20 degrees
Residue
iResidue
i+1Distance of hinge axis to residue i in
(A) Distance of hinge axis to residue i in
(A) Change in
(deg) Change in
(deg) Angle of psi(i) axis to hinge axis
(deg) Angle of psi(i) axis to hinge axis
(deg) Percentage Progress
SER-167
ARG-168
8.2
7.1
-87.1
48.6
29.0
11.4
279.5
ARG-168
THR-169
8.7
8.3
52.5
-71.3
129.2
134.8
91.0
THR-169
SER-170
10.2
7.6
-31.1
27.0
64.1
70.5
89.6

Graph shows rotational transition at bending residues and can be used
to identify hinge bending residues.
Probably only informative for interdomain rotations greater than 20 degrees
Residue
iResidue
i+1Distance of hinge axis to residue i in
(A) Distance of hinge axis to residue i in
(A) Change in
(deg) Change in
(deg) Angle of psi(i) axis to hinge axis
(deg) Angle of psi(i) axis to hinge axis
(deg) Percentage Progress
GLY-179
SER-180
10.4
10.0
26.6
-7.4
78.3
74.7
12.1
SER-180
GLN-181
10.9
11.1
-4.5
-3.2
103.5
107.4
-67.2
GLN-181
TYR-182
13.8
14.0
-21.0
9.4
40.7
43.7
72.9
TYR-182
ALA-183
16.9
16.8
64.4
-96.6
93.3
84.2
-55.5

Graph shows rotational transition at bending residues and can be used
to identify hinge bending residues.
Probably only informative for interdomain rotations greater than 20 degrees
Residue
iResidue
i+1Distance of hinge axis to residue i in
(A) Distance of hinge axis to residue i in
(A) Change in
(deg) Change in
(deg) Angle of psi(i) axis to hinge axis
(deg) Angle of psi(i) axis to hinge axis
(deg) Percentage Progress
ALA-286
SER-287
17.3
17.5
48.5
-59.5
68.0
73.3
-14.1
SER-287
GLY-288
14.8
14.6
-15.0
12.3
146.0
155.3
-108.9
GLY-288
LEU-289
13.7
13.4
10.8
37.3
66.4
67.9
143.1
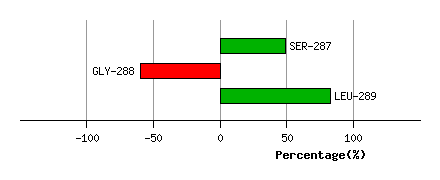
Graph shows rotational transition at bending residues and can be used
to identify hinge bending residues.
Probably only informative for interdomain rotations greater than 20 degrees
Residue
iResidue
i+1Distance of hinge axis to residue i in
(A) Distance of hinge axis to residue i in
(A) Change in
(deg) Change in
(deg) Angle of psi(i) axis to hinge axis
(deg) Angle of psi(i) axis to hinge axis
(deg) Percentage Progress
ILE-291
LYS-292
9.6
8.2
4.8
-12.3
107.4
111.5
23.6
LYS-292
LEU-293
8.2
7.0
-4.4
-15.5
10.3
7.8
121.4
LEU-293
ALA-294
9.0
7.9
-0.6
17.5
68.7
65.8
-167.2

Graph shows rotational transition at bending residues and can be used
to identify hinge bending residues.
Probably only informative for interdomain rotations greater than 20 degrees
Residue
iResidue
i+1Distance of hinge axis to residue i in
(A) Distance of hinge axis to residue i in
(A) Change in
(deg) Change in
(deg) Angle of psi(i) axis to hinge axis
(deg) Angle of psi(i) axis to hinge axis
(deg) Percentage Progress
ALA-304
ALA-305
17.7
16.4
-24.5
19.4
99.8
85.8
-33.9
ALA-305
ILE-306
15.3
14.1
-4.3
-6.1
23.2
26.0
7.7
ILE-306
ARG-307
15.0
13.7
-7.8
20.2
81.4
82.2
73.6
ARG-307
ALA-308
18.7
17.4
-23.1
5.8
124.8
128.7
-165.3

Graph shows rotational transition at bending residues and can be used
to identify hinge bending residues.
Probably only informative for interdomain rotations greater than 20 degrees
Residue
iResidue
i+1Distance of hinge axis to residue i in
(A) Distance of hinge axis to residue i in
(A) Change in
(deg) Change in
(deg) Angle of psi(i) axis to hinge axis
(deg) Angle of psi(i) axis to hinge axis
(deg) Percentage Progress
LEU-310
ALA-311
19.1
18.0
-25.4
46.5
98.3
102.8
108.6
ALA-311
LYS-312
22.4
21.3
-49.2
46.9
102.8
97.4
-51.2
LYS-312
MET-313
22.1
21.3
-15.5
45.4
37.7
24.8
-73.9
MET-313
GLU-314
21.8
21.3
-109.3
106.1
40.7
68.9
98.4
GLU-314
PRO-315
24.5
24.0
-14.7
0.4
94.1
90.1
-20.2
GLU-314
PRO-315
24.5
24.0
-14.7
0.4
94.1
90.1
-20.2

Graph shows rotational transition at bending residues and can be used
to identify hinge bending residues.
Probably only informative for interdomain rotations greater than 20 degrees
Residue
iResidue
i+1Distance of hinge axis to residue i in
(A) Distance of hinge axis to residue i in
(A) Change in
(deg) Change in
(deg) Angle of psi(i) axis to hinge axis
(deg) Angle of psi(i) axis to hinge axis
(deg) Percentage Progress
GLU-314
PRO-315
24.5
24.0
-14.7
0.4
94.1
90.1
-20.2
GLU-314
PRO-315
24.5
24.0
-14.7
0.4
94.1
90.1
-20.2
PRO-315
PHE-316
27.5
26.9
0.4
-1.7
120.6
123.5
128.1
PHE-316
PHE-317
26.7
26.3
-13.0
-18.7
18.9
15.9
185.3

Graph shows rotational transition at bending residues and can be used
to identify hinge bending residues.
Probably only informative for interdomain rotations greater than 20 degrees
Residue
iResidue
i+1Distance of hinge axis to residue i in
(A) Distance of hinge axis to residue i in
(A) Change in
(deg) Change in
(deg) Angle of psi(i) axis to hinge axis
(deg) Angle of psi(i) axis to hinge axis
(deg) Percentage Progress
PRO-318
SER-319
27.1
26.8
-10.0
34.9
110.7
98.6
124.1
SER-319
GLY-320
29.9
29.4
-178.6
167.6
118.0
88.4
-10.4
GLY-320
LEU-321
28.7
28.3
-22.8
16.0
97.8
90.5
-96.2

Graph shows rotational transition at bending residues and can be used
to identify hinge bending residues.
Probably only informative for interdomain rotations greater than 20 degrees
Residue
iResidue
i+1Distance of hinge axis to residue i in
(A) Distance of hinge axis to residue i in
(A) Change in
(deg) Change in
(deg) Angle of psi(i) axis to hinge axis
(deg) Angle of psi(i) axis to hinge axis
(deg) Percentage Progress
GLN-569
GLY-570
24.4
24.2
0.9
16.3
99.7
109.1
-6.2
GLY-570
VAL-571
25.6
25.0
21.0
-23.6
125.3
122.2
-9.7
VAL-571
PHE-572
22.3
21.7
-32.9
38.6
64.9
68.7
29.0
PHE-572
MET-573
20.4
20.0
-0.7
1.0
43.5
52.2
82.2
MET-573
THR-574
17.8
17.2
8.0
15.6
153.6
148.5
-159.3

Graph shows rotational transition at bending residues and can be used
to identify hinge bending residues.
Probably only informative for interdomain rotations greater than 20 degrees
Residue
iResidue
i+1Distance of hinge axis to residue i in
(A) Distance of hinge axis to residue i in
(A) Change in
(deg) Change in
(deg) Angle of psi(i) axis to hinge axis
(deg) Angle of psi(i) axis to hinge axis
(deg) Percentage Progress
MET-575
VAL-576
14.6
14.1
33.6
-40.3
176.2
159.5
66.3
VAL-576
GLN-577
13.0
12.8
-113.8
111.7
80.6
63.4
-3.5
GLN-577
LEU-578
11.2
10.7
32.2
-30.6
164.3
167.2
2.4

Graph shows rotational transition at bending residues and can be used
to identify hinge bending residues.
Probably only informative for interdomain rotations greater than 20 degrees
Residue
iResidue
i+1Distance of hinge axis to residue i in
(A) Distance of hinge axis to residue i in
(A) Change in
(deg) Change in
(deg) Angle of psi(i) axis to hinge axis
(deg) Angle of psi(i) axis to hinge axis
(deg) Percentage Progress
GLY-581
ALA-582
5.3
4.8
14.3
-2.2
83.6
67.8
20.0
ALA-582
THR-583
4.8
4.3
19.5
-5.1
116.8
96.8
-37.9
THR-583
GLN-584
3.5
3.3
-23.9
2.8
48.5
44.1
65.8

Graph shows rotational transition at bending residues and can be used
to identify hinge bending residues.
Probably only informative for interdomain rotations greater than 20 degrees
Residue
iResidue
i+1Distance of hinge axis to residue i in
(A) Distance of hinge axis to residue i in
(A) Change in
(deg) Change in
(deg) Angle of psi(i) axis to hinge axis
(deg) Angle of psi(i) axis to hinge axis
(deg) Percentage Progress
GLU-585
ARG-586
8.6
8.1
24.9
-36.5
87.8
101.4
27.2
ARG-586
THR-587
9.1
8.4
15.0
-0.9
25.3
30.9
72.8
THR-587
GLN-588
9.3
8.5
7.8
-6.7
79.2
70.8
5.2
GLN-588
LYS-589
11.4
11.1
-2.4
27.5
63.8
61.7
-40.8
LYS-589
VAL-590
13.6
13.1
-10.1
13.8
112.3
117.3
10.4
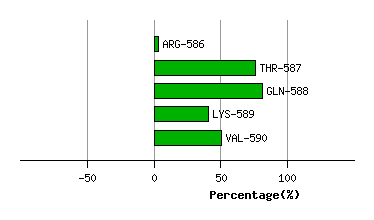
Graph shows rotational transition at bending residues and can be used
to identify hinge bending residues.
Probably only informative for interdomain rotations greater than 20 degrees
Residue
iResidue
i+1Distance of hinge axis to residue i in
(A) Distance of hinge axis to residue i in
(A) Change in
(deg) Change in
(deg) Angle of psi(i) axis to hinge axis
(deg) Angle of psi(i) axis to hinge axis
(deg) Percentage Progress
VAL-612
ASN-613
11.0
11.2
22.4
-51.3
137.3
132.4
172.6
ASN-613
GLY-614
9.0
8.6
-152.1
-165.4
96.9
95.2
-97.4
GLY-614
PHE-615
5.3
4.7
-64.3
86.1
152.3
148.4
126.6

Graph shows rotational transition at bending residues and can be used
to identify hinge bending residues.
Probably only informative for interdomain rotations greater than 20 degrees
Residue
iResidue
i+1Distance of hinge axis to residue i in
(A) Distance of hinge axis to residue i in
(A) Change in
(deg) Change in
(deg) Angle of psi(i) axis to hinge axis
(deg) Angle of psi(i) axis to hinge axis
(deg) Percentage Progress
ALA-627
PHE-628
14.8
15.0
-49.8
33.3
46.3
34.2
106.8
PHE-628
VAL-629
16.6
16.3
-6.6
4.2
96.8
102.5
-40.6
VAL-629
SER-630
20.4
20.0
-7.1
1.6
30.2
25.1
49.6

Graph shows rotational transition at bending residues and can be used
to identify hinge bending residues.
Probably only informative for interdomain rotations greater than 20 degrees
Residue
iResidue
i+1Distance of hinge axis to residue i in
(A) Distance of hinge axis to residue i in
(A) Change in
(deg) Change in
(deg) Angle of psi(i) axis to hinge axis
(deg) Angle of psi(i) axis to hinge axis
(deg) Percentage Progress
ASN-667
LEU-668
22.5
22.3
-36.4
39.0
125.3
124.6
111.7
LEU-668
PRO-669
20.4
20.2
12.4
3.8
44.7
45.5
24.5
PRO-669
ALA-670
22.2
22.5
-122.3
35.2
160.9
161.4
-436.7
ALA-670
ILE-671
20.9
22.3
62.7
117.9
102.4
49.5
414.9
ILE-671
VAL-672
17.3
21.2
143.4
-155.3
66.1
113.5
-65.9
VAL-672
GLU-673
14.1
21.1
40.5
67.1
105.8
109.8
653.7
GLU-673
LEU-674
15.9
17.7
24.2
-3.6
153.1
100.9
-203.4
LEU-674
GLY-675
14.4
20.0
-41.7
175.6
41.7
134.7
-537.4
GLY-675
THR-676
14.3
23.5
-95.0
-115.6
99.1
50.9
572.2
THR-676
ALA-677
15.6
25.5
-29.2
82.1
39.6
42.3
-314.5
ALA-677
THR-678
18.6
23.4
-127.2
120.4
105.4
38.5
-5.9
THR-678
GLY-679
22.2
26.5
-52.3
1.2
51.4
44.1
238.7
GLY-679
PHE-680
24.0
26.5
-19.1
-1.1
115.4
113.6
-81.5

Graph shows rotational transition at bending residues and can be used
to identify hinge bending residues.
Probably only informative for interdomain rotations greater than 20 degrees
Residue
iResidue
i+1Distance of hinge axis to residue i in
(A) Distance of hinge axis to residue i in
(A) Change in
(deg) Change in
(deg) Angle of psi(i) axis to hinge axis
(deg) Angle of psi(i) axis to hinge axis
(deg) Percentage Progress
THR-724
PRO-725
10.6
10.8
7.1
16.5
44.0
60.4
103.9
PRO-725
GLN-726
10.2
10.8
21.5
-0.6
112.0
117.6
-9.4
GLN-726
PHE-727
11.2
11.7
33.3
-29.5
45.6
36.0
49.5

Graph shows rotational transition at bending residues and can be used
to identify hinge bending residues.
Probably only informative for interdomain rotations greater than 20 degrees
Residue
iResidue
i+1Distance of hinge axis to residue i in
(A) Distance of hinge axis to residue i in
(A) Change in
(deg) Change in
(deg) Angle of psi(i) axis to hinge axis
(deg) Angle of psi(i) axis to hinge axis
(deg) Percentage Progress
GLU-810
TYR-811
15.4
15.4
11.0
23.3
61.0
48.2
186.4
TYR-811
GLY-812
15.1
15.1
27.0
-30.3
26.9
27.1
-36.3
GLY-812
SER-813
15.5
14.9
-21.9
-0.4
115.4
121.9
-37.1

Graph shows rotational transition at bending residues and can be used
to identify hinge bending residues.
Probably only informative for interdomain rotations greater than 20 degrees
Residue
iResidue
i+1Distance of hinge axis to residue i in
(A) Distance of hinge axis to residue i in
(A) Change in
(deg) Change in
(deg) Angle of psi(i) axis to hinge axis
(deg) Angle of psi(i) axis to hinge axis
(deg) Percentage Progress
GLU-866
ARG-867
27.6
28.9
-1.8
-11.5
82.1
69.5
12.2
ARG-867
LEU-868
29.5
30.8
58.9
-108.9
167.3
164.9
282.0
LEU-868
SER-869
28.3
29.0
172.1
151.2
118.9
114.8
75.4
SER-869
GLY-870
29.3
28.9
126.3
-95.0
86.3
73.5
-33.5
GLY-870
ASN-871
32.8
32.3
106.6
-9.5
124.3
139.5
-533.7
ASN-871
GLN-872
34.3
33.6
109.7
60.5
172.7
99.5
924.0
GLN-872
ALA-873
33.3
37.0
164.2
-25.6
112.9
131.2
-445.4
ALA-873
PRO-874
35.6
37.5
3.8
5.9
111.0
116.8
4.7
PRO-874
SER-875
38.7
41.2
-85.6
105.0
43.0
48.4
-127.7
SER-875
LEU-876
37.3
40.6
-4.5
-18.1
48.9
33.4
130.5
LEU-876
TYR-877
35.7
38.3
-25.4
39.4
70.0
69.0
-14.8
TYR-877
ALA-878
39.2
40.3
16.8
-5.5
125.4
118.8
-44.6

Graph shows rotational transition at bending residues and can be used
to identify hinge bending residues.
Probably only informative for interdomain rotations greater than 20 degrees