Aspartate Aminotransferase (E.C.2.6.1.1)
(All numbering and residues are taken from first PDB file)
![]()
![]()
Bending Residue Dihedral Analysis
Residue
iResidue
i+1Distance of hinge axis to residue i in
(A) Distance of hinge axis to residue i in
(A) Change in
(deg) Change in
(deg) Angle of psi(i) axis to hinge axis
(deg) Angle of psi(i) axis to hinge axis
(deg) Percentage Progress
ILE-33
ASN-34
14.3
14.8
4.5
-5.7
132.9
130.4
17.2
ASN-34
LEU-35
12.9
12.8
-7.4
-12.5
70.5
68.0
122.1
LEU-35
GLY-36
10.0
10.0
18.5
18.0
127.7
135.8
-270.4
GLY-36
ILE-37
10.5
10.8
-128.3
23.4
121.4
95.9
-422.5

Graph shows rotational transition at bending residues and can be used
to identify hinge bending residues.
Probably only informative for interdomain rotations greater than 20 degrees
Residue
iResidue
i+1Distance of hinge axis to residue i in
(A) Distance of hinge axis to residue i in
(A) Change in
(deg) Change in
(deg) Angle of psi(i) axis to hinge axis
(deg) Angle of psi(i) axis to hinge axis
(deg) Percentage Progress
GLY-38
VAL-39
7.8
7.5
106.6
-32.9
38.9
28.2
845.9
VAL-39
TYR-40
7.7
7.4
-14.4
5.6
112.9
116.5
-28.1
TYR-40
LYS-41
4.4
4.4
-0.7
0.5
145.8
140.9
7.7
LYS-41
ASP-42
4.3
4.3
1.9
-11.2
63.8
63.0
-71.7
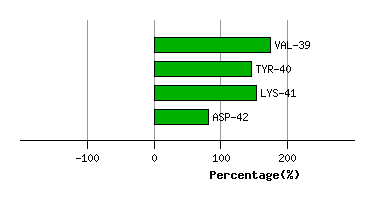
Graph shows rotational transition at bending residues and can be used
to identify hinge bending residues.
Probably only informative for interdomain rotations greater than 20 degrees
Residue
iResidue
i+1Distance of hinge axis to residue i in
(A) Distance of hinge axis to residue i in
(A) Change in
(deg) Change in
(deg) Angle of psi(i) axis to hinge axis
(deg) Angle of psi(i) axis to hinge axis
(deg) Percentage Progress
ILE-330
GLN-331
4.2
4.1
-1.5
4.1
119.2
120.5
50.5
GLN-331
ARG-332
7.7
7.6
0.9
5.0
110.4
111.6
-11.1
ARG-332
MET-333
9.3
9.1
-22.1
19.5
110.4
112.1
73.9
MET-333
ARG-334
7.9
7.9
-0.2
4.8
166.9
165.9
27.6

Graph shows rotational transition at bending residues and can be used
to identify hinge bending residues.
Probably only informative for interdomain rotations greater than 20 degrees
Residue
iResidue
i+1Distance of hinge axis to residue i in
(A) Distance of hinge axis to residue i in
(A) Change in
(deg) Change in
(deg) Angle of psi(i) axis to hinge axis
(deg) Angle of psi(i) axis to hinge axis
(deg) Percentage Progress
LYS-355
GLN-356
10.1
9.6
9.3
-4.3
86.8
90.5
-9.7
GLN-356
ASN-357
6.5
5.9
-7.2
9.1
149.4
146.7
15.4
ASN-357
GLY-358
6.0
5.7
7.2
-0.9
71.5
70.8
25.5
GLY-358
MET-359
3.9
3.8
9.3
-5.1
74.4
65.9
-1.2
MET-359
PHE-360
0.8
1.0
-6.8
0.3
44.8
55.6
18.2
PHE-360
SER-361
1.3
1.8
-18.8
60.2
48.2
50.7
-381.4
SER-361
PHE-362
2.9
4.0
-20.8
3.7
65.3
43.9
153.5
PHE-362
SER-363
5.4
4.8
-19.7
-1.4
98.9
86.9
16.3

Graph shows rotational transition at bending residues and can be used
to identify hinge bending residues.
Probably only informative for interdomain rotations greater than 20 degrees
Residue
iResidue
i+1Distance of hinge axis to residue i in
(A) Distance of hinge axis to residue i in
(A) Change in
(deg) Change in
(deg) Angle of psi(i) axis to hinge axis
(deg) Angle of psi(i) axis to hinge axis
(deg) Percentage Progress
GLY-385
ARG-386
9.8
9.9
3.7
-6.2
54.0
52.1
-9.4
ARG-386
VAL-387
7.0
7.1
-8.2
10.1
159.9
157.8
-19.0
VAL-387
ASN-388
7.0
7.4
8.5
1.3
52.0
50.7
153.3
ASN-388
VAL-389
5.1
5.6
-9.5
-1.8
128.9
125.6
-93.4

Graph shows rotational transition at bending residues and can be used
to identify hinge bending residues.
Probably only informative for interdomain rotations greater than 20 degrees