Bse634i Restriction Endonuclease
(All numbering and residues are taken from first PDB file)
![]()
![]()
Bending Residue Dihedral Analysis
Residue
iResidue
i+1Distance of hinge axis to residue i in
(A) Distance of hinge axis to residue i in
(A) Change in
(deg) Change in
(deg) Angle of psi(i) axis to hinge axis
(deg) Angle of psi(i) axis to hinge axis
(deg) Percentage Progress
ASN-89
TYR-90
1.6
1.7
-5.6
0.0
99.6
99.6
-2.2
TYR-90
ARG-91
2.4
2.1
3.2
10.8
21.5
17.7
120.5
ARG-91
VAL-92
2.4
1.8
-18.1
9.2
100.3
99.6
-65.9
VAL-92
LYS-93
3.5
3.3
-0.6
4.0
112.6
110.4
30.8
VAL-92
LYS-93
3.5
3.3
-0.6
4.0
112.6
110.4
30.8

Graph shows rotational transition at bending residues and can be used
to identify hinge bending residues.
Probably only informative for interdomain rotations greater than 20 degrees
Residue
iResidue
i+1Distance of hinge axis to residue i in
(A) Distance of hinge axis to residue i in
(A) Change in
(deg) Change in
(deg) Angle of psi(i) axis to hinge axis
(deg) Angle of psi(i) axis to hinge axis
(deg) Percentage Progress
VAL-92
LYS-93
3.5
3.3
-0.6
4.0
112.6
110.4
30.8
VAL-92
LYS-93
3.5
3.3
-0.6
4.0
112.6
110.4
30.8
LYS-93
ARG-94
5.9
5.7
-4.3
4.4
68.2
64.8
-4.8
ARG-94
GLU-95
7.0
6.7
-4.1
3.6
16.3
17.2
2.5

Graph shows rotational transition at bending residues and can be used
to identify hinge bending residues.
Probably only informative for interdomain rotations greater than 20 degrees
Residue
iResidue
i+1Distance of hinge axis to residue i in
(A) Distance of hinge axis to residue i in
(A) Change in
(deg) Change in
(deg) Angle of psi(i) axis to hinge axis
(deg) Angle of psi(i) axis to hinge axis
(deg) Percentage Progress
LEU-96
ASN-97
5.3
5.0
5.5
4.7
47.0
50.0
91.1
ASN-97
ASP-98
3.6
3.2
-34.6
29.1
127.8
120.0
-83.5
ASP-98
TYR-99
4.0
3.8
-7.5
6.8
60.6
59.2
17.9

Graph shows rotational transition at bending residues and can be used
to identify hinge bending residues.
Probably only informative for interdomain rotations greater than 20 degrees
Residue
iResidue
i+1Distance of hinge axis to residue i in
(A) Distance of hinge axis to residue i in
(A) Change in
(deg) Change in
(deg) Angle of psi(i) axis to hinge axis
(deg) Angle of psi(i) axis to hinge axis
(deg) Percentage Progress
TYR-160
ASN-161
5.8
6.0
0.7
4.7
62.4
58.7
70.8
ASN-161
LEU-162
5.8
5.9
-7.2
7.7
135.3
138.4
3.5
LEU-162
PRO-163
8.4
8.5
-5.5
4.1
146.2
144.1
25.9

Graph shows rotational transition at bending residues and can be used
to identify hinge bending residues.
Probably only informative for interdomain rotations greater than 20 degrees
Residue
iResidue
i+1Distance of hinge axis to residue i in
(A) Distance of hinge axis to residue i in
(A) Change in
(deg) Change in
(deg) Angle of psi(i) axis to hinge axis
(deg) Angle of psi(i) axis to hinge axis
(deg) Percentage Progress
HIS-169
GLU-170
17.6
17.8
18.1
-24.1
20.1
15.7
-50.6
GLU-170
ASN-171
16.4
16.5
9.9
3.4
80.7
76.7
53.7
ASN-171
ILE-172
12.6
12.8
-14.1
7.9
72.5
88.4
23.4
ILE-172
ASP-173
13.0
13.4
8.8
-12.1
43.5
33.5
-50.9
ASP-173
VAL-174
15.5
15.4
-0.1
6.8
142.1
141.5
107.3
VAL-174
ALA-175
12.8
12.8
-4.2
3.0
81.9
84.9
1.4

Graph shows rotational transition at bending residues and can be used
to identify hinge bending residues.
Probably only informative for interdomain rotations greater than 20 degrees
Residue
iResidue
i+1Distance of hinge axis to residue i in
(A) Distance of hinge axis to residue i in
(A) Change in
(deg) Change in
(deg) Angle of psi(i) axis to hinge axis
(deg) Angle of psi(i) axis to hinge axis
(deg) Percentage Progress
THR-278
SER-279
10.2
10.5
0.9
-4.0
92.4
90.9
24.8
SER-279
PHE-280
6.7
7.0
6.7
-5.1
163.7
160.3
-18.6
PHE-280
GLU-281
4.6
4.8
1.6
-1.8
121.3
122.7
-3.2
GLU-281
ASP-282
6.3
6.5
-1.2
0.0
69.0
67.5
-3.4
ASP-282
ILE-283
9.3
9.5
-8.6
10.6
27.7
29.4
-15.1
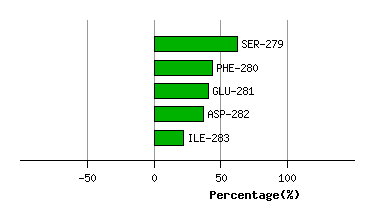
Graph shows rotational transition at bending residues and can be used
to identify hinge bending residues.
Probably only informative for interdomain rotations greater than 20 degrees