Adenosine Kinase
(All numbering and residues are taken from first PDB file)
![]()
![]()
Bending Residue Dihedral Analysis
Residue
iResidue
i+1Distance of hinge axis to residue i in
(A) Distance of hinge axis to residue i in
(A) Change in
(deg) Change in
(deg) Angle of psi(i) axis to hinge axis
(deg) Angle of psi(i) axis to hinge axis
(deg) Percentage Progress
ASN-20
PRO-21
4.7
4.7
-8.4
-5.4
53.0
54.4
39.3
PRO-21
ILE-22
3.5
3.6
6.2
10.2
72.2
72.6
2.5
ILE-22
LEU-23
1.6
2.0
-32.0
16.8
45.1
49.1
37.5

Graph shows rotational transition at bending residues and can be used
to identify hinge bending residues.
Probably only informative for interdomain rotations greater than 20 degrees
Residue
iResidue
i+1Distance of hinge axis to residue i in
(A) Distance of hinge axis to residue i in
(A) Change in
(deg) Change in
(deg) Angle of psi(i) axis to hinge axis
(deg) Angle of psi(i) axis to hinge axis
(deg) Percentage Progress
PRO-67
GLY-68
4.5
4.9
2.9
-16.5
80.9
84.3
6.8
GLY-68
GLY-69
1.3
1.3
-20.2
-1.8
62.2
50.1
21.0
GLY-69
SER-70
2.1
2.0
27.4
-8.3
46.7
48.8
67.1

Graph shows rotational transition at bending residues and can be used
to identify hinge bending residues.
Probably only informative for interdomain rotations greater than 20 degrees
Residue
iResidue
i+1Distance of hinge axis to residue i in
(A) Distance of hinge axis to residue i in
(A) Change in
(deg) Change in
(deg) Angle of psi(i) axis to hinge axis
(deg) Angle of psi(i) axis to hinge axis
(deg) Percentage Progress
SER-123
THR-124
6.4
6.8
-5.9
4.0
41.8
41.4
-22.4
THR-124
GLY-125
5.2
5.8
2.5
1.6
101.3
107.8
2.2
GLY-125
THR-126
2.5
2.9
-17.7
-2.4
43.0
43.7
65.6
THR-126
CYS-127
5.2
5.6
-4.3
0.7
77.8
73.5
14.5
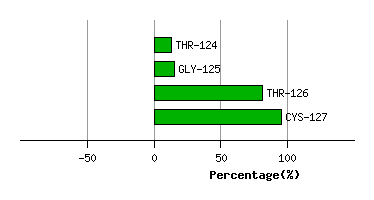
Graph shows rotational transition at bending residues and can be used
to identify hinge bending residues.
Probably only informative for interdomain rotations greater than 20 degrees
Residue
iResidue
i+1Distance of hinge axis to residue i in
(A) Distance of hinge axis to residue i in
(A) Change in
(deg) Change in
(deg) Angle of psi(i) axis to hinge axis
(deg) Angle of psi(i) axis to hinge axis
(deg) Percentage Progress
HIS-141
LEU-142
5.8
5.8
7.9
-8.9
84.5
84.8
16.5
LEU-142
GLY-143
2.6
2.4
7.1
0.0
114.5
121.2
26.6
GLY-143
ALA-144
1.5
1.9
1.3
-4.9
96.7
99.7
20.7
ALA-144
CYS-145
3.2
3.3
9.8
0.6
65.2
64.1
19.7

Graph shows rotational transition at bending residues and can be used
to identify hinge bending residues.
Probably only informative for interdomain rotations greater than 20 degrees