Bovine Mitochondrial F1-Atpase
(All numbering and residues are taken from first PDB file)
![]()
![]()
Bending Residue Dihedral Analysis
Residue
iResidue
i+1Distance of hinge axis to residue i in
(A) Distance of hinge axis to residue i in
(A) Change in
(deg) Change in
(deg) Angle of psi(i) axis to hinge axis
(deg) Angle of psi(i) axis to hinge axis
(deg) Percentage Progress
GLU-129
GLN-130
11.5
10.8
-14.8
-37.2
54.7
81.1
80.2
GLN-130
GLU-131
8.1
7.4
-13.6
16.8
90.6
91.3
-20.7
GLU-131
ILE-132
8.9
8.6
1.4
1.8
124.3
111.0
0.7
ILE-132
LEU-133
7.6
7.6
0.3
-11.2
145.4
149.7
29.9
LEU-133
VAL-134
8.8
8.4
-18.1
10.5
85.6
90.6
-7.3

Graph shows rotational transition at bending residues and can be used
to identify hinge bending residues.
Probably only informative for interdomain rotations greater than 20 degrees
Residue
iResidue
i+1Distance of hinge axis to residue i in
(A) Distance of hinge axis to residue i in
(A) Change in
(deg) Change in
(deg) Angle of psi(i) axis to hinge axis
(deg) Angle of psi(i) axis to hinge axis
(deg) Percentage Progress
ILE-170
ASN-171
10.1
9.6
19.4
-15.0
97.5
92.9
-3.0
ASN-171
ASN-172
13.9
13.4
1.2
-9.9
155.0
148.5
8.3
ASN-172
VAL-173
14.1
13.9
-2.2
-42.9
79.4
72.3
84.8

Graph shows rotational transition at bending residues and can be used
to identify hinge bending residues.
Probably only informative for interdomain rotations greater than 20 degrees
Residue
iResidue
i+1Distance of hinge axis to residue i in
(A) Distance of hinge axis to residue i in
(A) Change in
(deg) Change in
(deg) Angle of psi(i) axis to hinge axis
(deg) Angle of psi(i) axis to hinge axis
(deg) Percentage Progress
LEU-329
ASP-330
6.1
6.1
24.3
4.2
26.4
22.7
81.8
ASP-330
ALA-331
3.3
3.6
-23.9
36.4
99.9
103.0
-2.2
ALA-331
THR-332
3.8
3.4
-15.5
-8.1
36.9
48.7
89.8
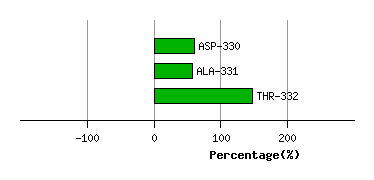
Graph shows rotational transition at bending residues and can be used
to identify hinge bending residues.
Probably only informative for interdomain rotations greater than 20 degrees