Phosphomannomutase
(All numbering and residues are taken from first PDB file)
![]()
![]()
Bending Residue Dihedral Analysis
Residue
iResidue
i+1Distance of hinge axis to residue i in
(A) Distance of hinge axis to residue i in
(A) Change in
(deg) Change in
(deg) Angle of psi(i) axis to hinge axis
(deg) Angle of psi(i) axis to hinge axis
(deg) Percentage Progress
VAL-284
LYS-285
4.6
5.6
-9.9
13.8
128.3
130.8
2.3
LYS-285
CYS-286
6.7
7.7
-7.0
5.7
148.7
144.3
14.0
CYS-286
THR-287
3.9
4.8
10.8
-12.1
90.4
90.1
5.6
THR-287
ARG-288
3.4
3.7
1.6
7.0
114.1
116.8
-20.8
ARG-288
ARG-289
4.0
3.7
-8.2
0.3
132.6
130.9
-33.0

Graph shows rotational transition at bending residues and can be used
to identify hinge bending residues.
Probably only informative for interdomain rotations greater than 20 degrees
Residue
iResidue
i+1Distance of hinge axis to residue i in
(A) Distance of hinge axis to residue i in
(A) Change in
(deg) Change in
(deg) Angle of psi(i) axis to hinge axis
(deg) Angle of psi(i) axis to hinge axis
(deg) Percentage Progress
ALA-366
PHE-367
5.0
5.0
-7.3
-4.2
10.8
9.8
108.9
PHE-367
PRO-368
4.4
4.4
-5.4
4.6
69.5
69.3
28.5
PRO-368
SER-369
6.9
6.6
2.3
-1.2
108.5
106.1
2.5

Graph shows rotational transition at bending residues and can be used
to identify hinge bending residues.
Probably only informative for interdomain rotations greater than 20 degrees
Residue
iResidue
i+1Distance of hinge axis to residue i in
(A) Distance of hinge axis to residue i in
(A) Change in
(deg) Change in
(deg) Angle of psi(i) axis to hinge axis
(deg) Angle of psi(i) axis to hinge axis
(deg) Percentage Progress
ILE-371
SER-372
12.8
12.3
7.2
-0.8
43.3
44.3
27.2
SER-372
THR-373
12.0
11.7
3.9
9.0
92.0
88.0
-7.4
THR-373
PRO-374
14.7
14.4
-6.5
6.5
82.7
75.1
108.2
PRO-374
GLU-375
15.1
15.4
-20.7
26.8
158.6
164.5
38.8
GLU-375
ILE-376
15.2
15.7
8.1
-2.6
70.8
69.1
-115.1
ILE-376
ASN-377
18.0
18.1
0.4
-11.9
43.0
46.9
-70.5
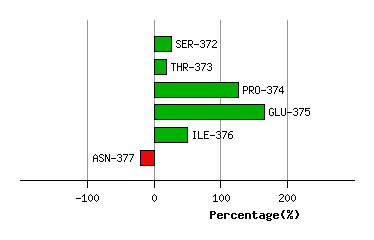
Graph shows rotational transition at bending residues and can be used
to identify hinge bending residues.
Probably only informative for interdomain rotations greater than 20 degrees
Residue
iResidue
i+1Distance of hinge axis to residue i in
(A) Distance of hinge axis to residue i in
(A) Change in
(deg) Change in
(deg) Angle of psi(i) axis to hinge axis
(deg) Angle of psi(i) axis to hinge axis
(deg) Percentage Progress
GLN-397
TRP-398
14.7
14.6
5.4
6.3
165.7
171.7
-133.3
TRP-398
GLY-399
13.8
13.8
-22.6
-4.0
74.4
66.6
164.4
GLY-399
GLU-400
15.7
15.6
-51.5
48.2
96.1
79.7
-64.8
GLU-400
GLY-401
14.0
14.5
111.5
-132.1
127.3
136.8
46.1
GLY-401
ASN-402
11.3
11.2
21.8
-4.9
62.8
66.7
64.7
ASN-402
ILE-403
7.9
7.6
-15.0
3.5
93.7
97.5
-48.1
ILE-403
THR-404
6.0
6.0
7.0
-13.3
91.7
82.0
-1.4
THR-404
THR-405
2.9
3.0
3.9
0.9
71.2
71.1
9.9
THR-405
LEU-406
4.6
4.9
-5.2
-7.9
85.8
86.8
23.8
LEU-406
ASP-407
5.0
5.3
10.1
1.7
104.6
109.5
4.3
ASP-407
GLY-408
8.0
8.3
4.7
-0.6
85.2
82.8
20.1
ASP-407
GLY-408
8.0
8.3
4.7
-0.6
85.2
82.8
20.1

Graph shows rotational transition at bending residues and can be used
to identify hinge bending residues.
Probably only informative for interdomain rotations greater than 20 degrees
Residue
iResidue
i+1Distance of hinge axis to residue i in
(A) Distance of hinge axis to residue i in
(A) Change in
(deg) Change in
(deg) Angle of psi(i) axis to hinge axis
(deg) Angle of psi(i) axis to hinge axis
(deg) Percentage Progress
ASP-407
GLY-408
8.0
8.3
4.7
-0.6
85.2
82.8
20.1
ASP-407
GLY-408
8.0
8.3
4.7
-0.6
85.2
82.8
20.1
GLY-408
VAL-409
9.5
9.8
5.0
-5.6
99.5
100.7
-28.2
VAL-409
ARG-410
8.5
8.5
8.5
0.8
27.0
20.8
59.9
ARG-410
VAL-411
6.9
7.0
1.7
1.7
106.1
104.0
-24.8
VAL-411
ASP-412
8.1
8.1
4.6
-3.7
35.1
27.6
12.8

Graph shows rotational transition at bending residues and can be used
to identify hinge bending residues.
Probably only informative for interdomain rotations greater than 20 degrees
Residue
iResidue
i+1Distance of hinge axis to residue i in
(A) Distance of hinge axis to residue i in
(A) Change in
(deg) Change in
(deg) Angle of psi(i) axis to hinge axis
(deg) Angle of psi(i) axis to hinge axis
(deg) Percentage Progress
GLY-416
TRP-417
11.4
11.1
5.4
2.3
37.6
36.0
58.1
TRP-417
GLY-418
9.7
9.5
-10.7
11.8
86.5
92.5
20.2
GLY-418
LEU-419
10.6
10.8
-0.5
-8.7
127.4
124.8
-58.7
LEU-419
VAL-420
10.0
10.2
-0.4
3.1
106.8
105.9
-32.8

Graph shows rotational transition at bending residues and can be used
to identify hinge bending residues.
Probably only informative for interdomain rotations greater than 20 degrees