Sucrose Hydrolase
(All numbering and residues are taken from first PDB file)
![]()
![]()
Bending Residue Dihedral Analysis
Residue
iResidue
i+1Distance of hinge axis to residue i in
(A) Distance of hinge axis to residue i in
(A) Change in
(deg) Change in
(deg) Angle of psi(i) axis to hinge axis
(deg) Angle of psi(i) axis to hinge axis
(deg) Percentage Progress
ASP-78
SER-79
5.0
4.9
-3.2
2.6
164.4
167.0
-17.5
SER-79
THR-80
7.0
6.8
-11.4
12.9
130.2
128.3
8.9
THR-80
ARG-81
7.5
7.3
-4.6
14.7
97.2
95.8
-39.5

Graph shows rotational transition at bending residues and can be used
to identify hinge bending residues.
Probably only informative for interdomain rotations greater than 20 degrees
Residue
iResidue
i+1Distance of hinge axis to residue i in
(A) Distance of hinge axis to residue i in
(A) Change in
(deg) Change in
(deg) Angle of psi(i) axis to hinge axis
(deg) Angle of psi(i) axis to hinge axis
(deg) Percentage Progress
LEU-123
HIS-124
14.0
14.1
-6.0
5.0
120.5
122.4
37.5
HIS-124
LEU-125
13.3
13.3
-3.5
5.8
162.7
164.0
31.5
LEU-125
LEU-126
12.9
12.9
0.8
0.1
65.4
64.5
25.1

Graph shows rotational transition at bending residues and can be used
to identify hinge bending residues.
Probably only informative for interdomain rotations greater than 20 degrees
Residue
iResidue
i+1Distance of hinge axis to residue i in
(A) Distance of hinge axis to residue i in
(A) Change in
(deg) Change in
(deg) Angle of psi(i) axis to hinge axis
(deg) Angle of psi(i) axis to hinge axis
(deg) Percentage Progress
GLY-134
ASP-135
13.7
13.8
-5.0
-7.4
148.4
146.7
-226.2
ASP-135
ASN-136
16.3
16.5
2.3
13.4
42.0
46.8
263.8
ASN-136
ASP-137
14.8
14.7
2.8
2.2
29.5
27.0
90.7
ASP-137
GLY-138
17.6
17.5
4.6
-10.1
53.9
51.6
-84.0
GLY-138
GLY-139
16.4
16.6
4.5
-2.6
63.3
63.8
-14.5
GLY-139
PHE-140
12.8
13.0
-5.0
4.7
124.2
120.6
3.3
GLY-139
PHE-140
12.8
13.0
-5.0
4.7
124.2
120.6
3.3

Graph shows rotational transition at bending residues and can be used
to identify hinge bending residues.
Probably only informative for interdomain rotations greater than 20 degrees
Residue
iResidue
i+1Distance of hinge axis to residue i in
(A) Distance of hinge axis to residue i in
(A) Change in
(deg) Change in
(deg) Angle of psi(i) axis to hinge axis
(deg) Angle of psi(i) axis to hinge axis
(deg) Percentage Progress
GLY-139
PHE-140
12.8
13.0
-5.0
4.7
124.2
120.6
3.3
GLY-139
PHE-140
12.8
13.0
-5.0
4.7
124.2
120.6
3.3
PHE-140
ALA-141
13.9
14.1
2.2
-3.0
116.5
117.7
-34.3
ALA-141
VAL-142
13.2
13.3
-4.6
2.7
85.1
84.2
-14.3
VAL-142
SER-143
9.6
9.7
-1.5
-2.2
127.3
125.9
-33.9
VAL-142
SER-143
9.6
9.7
-1.5
-2.2
127.3
125.9
-33.9

Graph shows rotational transition at bending residues and can be used
to identify hinge bending residues.
Probably only informative for interdomain rotations greater than 20 degrees
Residue
iResidue
i+1Distance of hinge axis to residue i in
(A) Distance of hinge axis to residue i in
(A) Change in
(deg) Change in
(deg) Angle of psi(i) axis to hinge axis
(deg) Angle of psi(i) axis to hinge axis
(deg) Percentage Progress
VAL-142
SER-143
9.6
9.7
-1.5
-2.2
127.3
125.9
-33.9
VAL-142
SER-143
9.6
9.7
-1.5
-2.2
127.3
125.9
-33.9
SER-143
ASP-144
7.7
7.9
10.9
-6.0
109.8
107.8
29.4
ASP-144
TYR-145
4.9
5.1
-0.8
-0.2
22.1
24.1
4.1
TYR-145
GLY-146
4.7
4.8
3.1
-0.6
104.6
103.8
-20.3
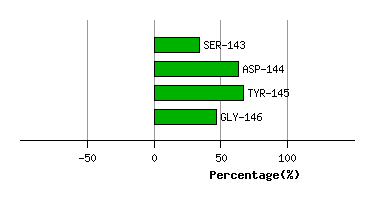
Graph shows rotational transition at bending residues and can be used
to identify hinge bending residues.
Probably only informative for interdomain rotations greater than 20 degrees
Residue
iResidue
i+1Distance of hinge axis to residue i in
(A) Distance of hinge axis to residue i in
(A) Change in
(deg) Change in
(deg) Angle of psi(i) axis to hinge axis
(deg) Angle of psi(i) axis to hinge axis
(deg) Percentage Progress
ALA-168
GLY-169
17.5
17.3
18.1
-14.7
132.2
126.3
-68.6
GLY-169
ILE-170
14.7
14.7
-11.7
9.3
111.3
115.7
-6.4
ILE-170
SER-171
13.5
13.7
-7.2
6.0
106.6
108.5
-7.2

Graph shows rotational transition at bending residues and can be used
to identify hinge bending residues.
Probably only informative for interdomain rotations greater than 20 degrees
Residue
iResidue
i+1Distance of hinge axis to residue i in
(A) Distance of hinge axis to residue i in
(A) Change in
(deg) Change in
(deg) Angle of psi(i) axis to hinge axis
(deg) Angle of psi(i) axis to hinge axis
(deg) Percentage Progress
PRO-315
ALA-316
2.3
2.3
-9.8
3.3
92.3
91.0
-60.1
ALA-316
VAL-317
1.7
1.6
2.3
2.4
123.1
125.4
-20.1
VAL-317
VAL-318
2.2
2.2
-2.6
-2.3
114.6
112.7
-119.1

Graph shows rotational transition at bending residues and can be used
to identify hinge bending residues.
Probably only informative for interdomain rotations greater than 20 degrees