Alpha-Enolase
(All numbering and residues are taken from first PDB file)
![]()
![]()
Bending Residue Dihedral Analysis
Residue
iResidue
i+1Distance of hinge axis to residue i in
(A) Distance of hinge axis to residue i in
(A) Change in
(deg) Change in
(deg) Angle of psi(i) axis to hinge axis
(deg) Angle of psi(i) axis to hinge axis
(deg) Percentage Progress
ALA-148
PHE-149
4.8
4.5
6.9
-9.7
126.0
123.8
-18.3
PHE-149
ASN-150
5.8
5.6
-1.3
7.1
86.7
85.7
42.3
ASN-150
VAL-151
7.4
7.3
8.0
-17.5
161.7
159.6
64.4

Graph shows rotational transition at bending residues and can be used
to identify hinge bending residues.
Probably only informative for interdomain rotations greater than 20 degrees
Residue
iResidue
i+1Distance of hinge axis to residue i in
(A) Distance of hinge axis to residue i in
(A) Change in
(deg) Change in
(deg) Angle of psi(i) axis to hinge axis
(deg) Angle of psi(i) axis to hinge axis
(deg) Percentage Progress
PHE-167
MET-168
7.5
7.3
4.8
-1.0
77.6
73.6
41.3
MET-168
ILE-169
4.1
3.9
-1.2
9.7
104.8
108.9
27.5
ILE-169
LEU-170
0.7
0.5
5.1
-5.4
115.7
118.5
-4.2

Graph shows rotational transition at bending residues and can be used
to identify hinge bending residues.
Probably only informative for interdomain rotations greater than 20 degrees
Residue
iResidue
i+1Distance of hinge axis to residue i in
(A) Distance of hinge axis to residue i in
(A) Change in
(deg) Change in
(deg) Angle of psi(i) axis to hinge axis
(deg) Angle of psi(i) axis to hinge axis
(deg) Percentage Progress
GLU-209
GLY-210
14.4
14.1
-8.1
5.5
36.7
35.8
59.0
GLY-210
GLY-211
13.4
13.1
8.9
-14.0
109.3
108.7
14.5
GLY-211
PHE-212
11.0
11.0
22.0
-37.1
130.0
123.0
146.2
PHE-212
ALA-213
11.8
11.9
-1.3
-5.7
118.3
120.3
-28.7
ALA-213
PRO-214
15.0
14.7
4.5
5.0
123.8
133.3
-35.9
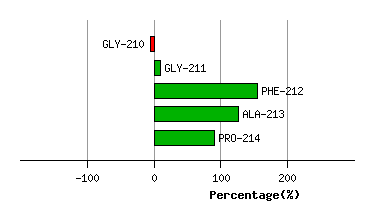
Graph shows rotational transition at bending residues and can be used
to identify hinge bending residues.
Probably only informative for interdomain rotations greater than 20 degrees
Residue
iResidue
i+1Distance of hinge axis to residue i in
(A) Distance of hinge axis to residue i in
(A) Change in
(deg) Change in
(deg) Angle of psi(i) axis to hinge axis
(deg) Angle of psi(i) axis to hinge axis
(deg) Percentage Progress
GLU-218
ASN-219
18.2
18.2
10.5
-3.7
104.4
105.5
-1.5
ASN-219
LYS-220
15.1
15.1
5.2
-1.1
72.1
69.4
-20.7
LYS-220
GLU-221
14.8
15.1
3.6
-6.0
21.6
23.3
-32.6
GLU-221
GLY-222
14.3
14.5
1.8
-1.0
90.4
91.7
51.8
GLY-222
LEU-223
11.5
11.5
-2.5
0.9
81.0
84.2
-24.1
LEU-223
GLU-224
9.9
10.1
-2.6
0.5
142.6
146.6
-38.4
GLU-224
LEU-225
11.2
11.3
-0.8
7.1
133.7
131.8
58.6
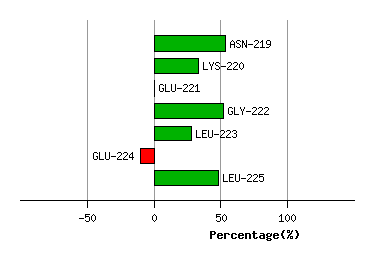
Graph shows rotational transition at bending residues and can be used
to identify hinge bending residues.
Probably only informative for interdomain rotations greater than 20 degrees
Residue
iResidue
i+1Distance of hinge axis to residue i in
(A) Distance of hinge axis to residue i in
(A) Change in
(deg) Change in
(deg) Angle of psi(i) axis to hinge axis
(deg) Angle of psi(i) axis to hinge axis
(deg) Percentage Progress
VAL-239
VAL-240
5.7
5.9
2.1
-4.7
55.3
55.0
-8.7
VAL-240
ILE-241
5.0
5.2
6.5
-5.8
89.0
84.9
58.2
ILE-241
GLY-242
3.7
3.9
-11.5
14.1
155.1
159.1
6.2

Graph shows rotational transition at bending residues and can be used
to identify hinge bending residues.
Probably only informative for interdomain rotations greater than 20 degrees
Residue
iResidue
i+1Distance of hinge axis to residue i in
(A) Distance of hinge axis to residue i in
(A) Change in
(deg) Change in
(deg) Angle of psi(i) axis to hinge axis
(deg) Angle of psi(i) axis to hinge axis
(deg) Percentage Progress
CYS-336
ASN-337
5.2
5.1
-7.5
3.5
79.8
79.7
22.7
ASN-337
CYS-338
1.9
2.0
-1.8
1.2
123.2
123.1
-21.1
CYS-338
LEU-339
1.8
1.5
-2.0
6.5
84.8
84.7
27.1
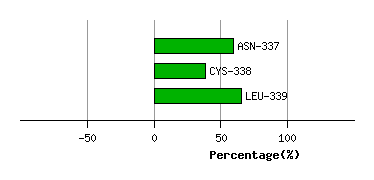
Graph shows rotational transition at bending residues and can be used
to identify hinge bending residues.
Probably only informative for interdomain rotations greater than 20 degrees