Alcohol Dehydrogenase
(All numbering and residues are taken from first PDB file)
![]()
![]()
Bending Residue Dihedral Analysis
Residue
iResidue
i+1Distance of hinge axis to residue i in
(A) Distance of hinge axis to residue i in
(A) Change in
(deg) Change in
(deg) Angle of psi(i) axis to hinge axis
(deg) Angle of psi(i) axis to hinge axis
(deg) Percentage Progress
VAL-169
CYS-170
6.9
6.8
4.0
-2.4
128.8
127.1
-17.1
CYS-170
LEU-171
7.0
7.0
-3.6
-2.7
56.2
57.9
13.3
LEU-171
ILE-172
3.4
3.4
5.1
-5.9
151.9
146.3
58.5
ILE-172
GLY-173
4.7
4.5
-3.3
1.2
45.7
40.4
-17.0
GLY-173
CYS-174
6.2
6.2
5.6
0.6
123.7
122.6
-45.1

Graph shows rotational transition at bending residues and can be used
to identify hinge bending residues.
Probably only informative for interdomain rotations greater than 20 degrees
Residue
iResidue
i+1Distance of hinge axis to residue i in
(A) Distance of hinge axis to residue i in
(A) Change in
(deg) Change in
(deg) Angle of psi(i) axis to hinge axis
(deg) Angle of psi(i) axis to hinge axis
(deg) Percentage Progress
GLY-175
PHE-176
2.5
2.5
12.6
-13.9
92.5
91.3
5.2
PHE-176
SER-177
1.6
1.6
-0.8
3.2
27.8
28.0
-22.1
SER-177
THR-178
2.6
2.8
-1.0
-1.0
44.3
45.2
38.8

Graph shows rotational transition at bending residues and can be used
to identify hinge bending residues.
Probably only informative for interdomain rotations greater than 20 degrees
Residue
iResidue
i+1Distance of hinge axis to residue i in
(A) Distance of hinge axis to residue i in
(A) Change in
(deg) Change in
(deg) Angle of psi(i) axis to hinge axis
(deg) Angle of psi(i) axis to hinge axis
(deg) Percentage Progress
SER-289
VAL-290
14.2
14.1
10.2
-11.6
88.0
87.5
27.0
VAL-290
ILE-291
10.7
10.6
-1.0
-3.6
67.1
64.7
88.6
ILE-291
VAL-292
9.9
10.2
8.9
-10.3
122.4
120.3
35.8
VAL-292
ALA-293
7.7
8.1
-23.7
90.9
76.9
73.4
-164.1
ALA-293
VAL-294
9.7
10.7
-4.3
72.3
124.9
131.7
627.3
VAL-294
THR-295
12.4
11.6
-15.2
-12.9
73.7
100.5
165.3
THR-295
PRO-296
15.0
14.9
26.5
-11.0
42.6
88.9
41.7
PRO-296
ASP-297
15.5
18.1
172.6
32.3
58.1
27.7
-1704.0
ASP-297
SER-298
19.0
18.4
71.3
87.7
54.1
41.2
1405.1
SER-298
GLN-299
17.6
19.2
-90.3
17.9
114.5
89.2
-263.1
GLN-299
ASN-300
19.9
20.1
-20.4
-13.9
116.9
114.2
-230.2
ASN-300
LEU-301
19.4
19.3
9.7
-10.9
112.0
111.2
-26.5
LEU-301
SER-302
19.6
19.7
-1.1
-0.5
141.9
143.7
-19.9
SER-302
MET-303
22.0
22.0
-0.1
1.2
84.5
80.0
-47.5
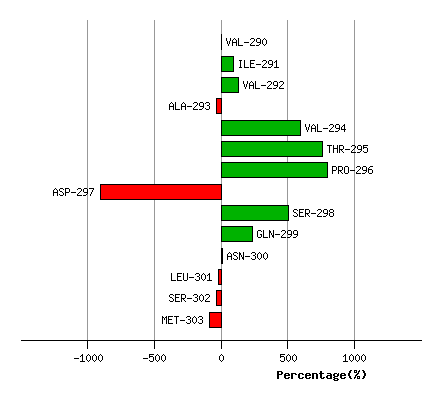
Graph shows rotational transition at bending residues and can be used
to identify hinge bending residues.
Probably only informative for interdomain rotations greater than 20 degrees
Residue
iResidue
i+1Distance of hinge axis to residue i in
(A) Distance of hinge axis to residue i in
(A) Change in
(deg) Change in
(deg) Angle of psi(i) axis to hinge axis
(deg) Angle of psi(i) axis to hinge axis
(deg) Percentage Progress
ALA-317
ILE-318
3.1
3.5
-4.5
-3.6
43.9
47.5
16.3
ILE-318
PHE-319
2.5
2.7
-11.9
1.8
59.3
57.5
125.4
PHE-319
GLY-320
1.5
1.4
-1.3
5.4
93.4
92.2
31.1

Graph shows rotational transition at bending residues and can be used
to identify hinge bending residues.
Probably only informative for interdomain rotations greater than 20 degrees
Residue
iResidue
i+1Distance of hinge axis to residue i in
(A) Distance of hinge axis to residue i in
(A) Change in
(deg) Change in
(deg) Angle of psi(i) axis to hinge axis
(deg) Angle of psi(i) axis to hinge axis
(deg) Percentage Progress
LEU-342
ASP-343
4.2
3.8
-2.2
5.5
135.9
138.1
30.9
ASP-343
PRO-344
3.2
3.3
-4.6
-0.7
86.7
86.9
55.2
PRO-344
LEU-345
5.6
5.6
0.3
6.4
121.9
118.8
-60.1
LEU-345
ILE-346
4.0
4.0
-6.5
1.9
117.1
121.6
2.6
ILE-346
THR-347
2.9
3.1
0.6
-1.4
42.6
40.3
-12.6

Graph shows rotational transition at bending residues and can be used
to identify hinge bending residues.
Probably only informative for interdomain rotations greater than 20 degrees