Tissue Factor
(All numbering and residues are taken from first PDB file)
![]()
![]()
Bending Residue Dihedral Analysis
Residue
iResidue
i+1Distance of hinge axis to residue i in
(A) Distance of hinge axis to residue i in
(A) Change in
(deg) Change in
(deg) Angle of psi(i) axis to hinge axis
(deg) Angle of psi(i) axis to hinge axis
(deg) Percentage Progress
ASN-105
LEU-106
6.0
6.1
0.2
-2.6
86.2
87.2
16.8
LEU-106
GLY-107
2.4
2.5
-2.0
5.3
158.9
158.9
21.9
GLY-107
GLN-108
3.5
3.6
-2.7
3.2
122.4
119.0
5.6
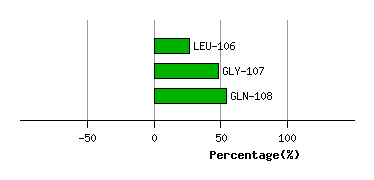
Graph shows rotational transition at bending residues and can be used
to identify hinge bending residues.
Probably only informative for interdomain rotations greater than 20 degrees
Residue
iResidue
i+1Distance of hinge axis to residue i in
(A) Distance of hinge axis to residue i in
(A) Change in
(deg) Change in
(deg) Angle of psi(i) axis to hinge axis
(deg) Angle of psi(i) axis to hinge axis
(deg) Percentage Progress
GLN-126
ASP-127
12.4
12.6
0.6
5.8
36.2
31.8
35.2
ASP-127
ALA-128
11.7
12.2
0.9
-10.0
96.5
99.0
3.9
ALA-128
ARG-129
9.2
9.6
11.3
26.3
40.3
42.3
197.9
ARG-129
THR-130
11.0
10.9
-38.3
38.0
72.8
90.2
71.8
THR-130
LEU-131
12.1
9.8
46.8
-13.4
73.5
82.9
35.2
LEU-131
VAL-132
15.8
12.4
-109.5
21.8
123.6
166.5
-653.9
THR-137
PHE-138
19.0
18.4
-37.1
34.4
53.1
79.8
57.0
PHE-138
LEU-139
15.8
15.2
-42.9
45.7
128.8
106.5
6.7
LEU-139
SER-140
12.2
12.6
35.7
2.5
120.5
131.4
-234.1
SER-140
LEU-141
10.4
10.5
19.3
6.1
79.5
78.7
81.4
LEU-141
ARG-142
6.7
6.8
-2.3
9.7
129.9
130.8
30.8

Graph shows rotational transition at bending residues and can be used
to identify hinge bending residues.
Probably only informative for interdomain rotations greater than 20 degrees
Residue
iResidue
i+1Distance of hinge axis to residue i in
(A) Distance of hinge axis to residue i in
(A) Change in
(deg) Change in
(deg) Angle of psi(i) axis to hinge axis
(deg) Angle of psi(i) axis to hinge axis
(deg) Percentage Progress
ARG-194
LYS-195
8.3
8.6
13.8
-12.5
111.9
109.9
23.8
LYS-195
ARG-196
11.9
12.2
3.4
0.4
158.3
157.4
-33.9
ARG-196
LYS-197
11.2
11.4
-2.5
-1.6
80.4
80.0
15.4
LYS-197
GLN-198
8.1
8.4
-2.4
-0.8
74.5
74.1
5.6
LYS-197
GLN-198
8.1
8.4
-2.4
-0.8
74.5
74.1
5.6

Graph shows rotational transition at bending residues and can be used
to identify hinge bending residues.
Probably only informative for interdomain rotations greater than 20 degrees
Residue
iResidue
i+1Distance of hinge axis to residue i in
(A) Distance of hinge axis to residue i in
(A) Change in
(deg) Change in
(deg) Angle of psi(i) axis to hinge axis
(deg) Angle of psi(i) axis to hinge axis
(deg) Percentage Progress
LYS-197
GLN-198
8.1
8.4
-2.4
-0.8
74.5
74.1
5.6
LYS-197
GLN-198
8.1
8.4
-2.4
-0.8
74.5
74.1
5.6
GLN-198
ARG-199
7.1
7.2
6.8
1.3
53.2
52.8
26.6
ARG-199
SER-200
5.3
5.5
-2.1
4.3
121.3
119.0
22.4

Graph shows rotational transition at bending residues and can be used
to identify hinge bending residues.
Probably only informative for interdomain rotations greater than 20 degrees