Dihydroflavonol 4-Reductase
(All numbering and residues are taken from first PDB file)
![]()
![]()
Bending Residue Dihedral Analysis
Residue
iResidue
i+1Distance of hinge axis to residue i in
(A) Distance of hinge axis to residue i in
(A) Change in
(deg) Change in
(deg) Angle of psi(i) axis to hinge axis
(deg) Angle of psi(i) axis to hinge axis
(deg) Percentage Progress
THR-7
VAL-8
10.6
10.6
-7.4
4.7
143.6
137.9
-6.5
VAL-8
CYS-9
8.9
8.9
0.4
7.0
103.3
104.5
-80.5
CYS-9
VAL-10
8.6
8.6
-3.6
6.7
138.0
135.1
99.9
VAL-10
THR-11
6.5
6.5
-0.9
3.6
81.7
80.7
-10.1
THR-11
GLY-12
9.3
9.4
-2.9
0.8
104.8
103.9
81.5

Graph shows rotational transition at bending residues and can be used
to identify hinge bending residues.
Probably only informative for interdomain rotations greater than 20 degrees
Residue
iResidue
i+1Distance of hinge axis to residue i in
(A) Distance of hinge axis to residue i in
(A) Change in
(deg) Change in
(deg) Angle of psi(i) axis to hinge axis
(deg) Angle of psi(i) axis to hinge axis
(deg) Percentage Progress
TRP-20
LEU-21
5.2
5.3
-9.0
9.0
94.9
94.8
-44.6
LEU-21
VAL-22
1.6
1.6
0.0
-6.6
26.3
25.8
123.2
VAL-22
MET-23
0.7
0.7
2.0
-0.1
111.7
110.5
-24.0
MET-23
ARG-24
4.2
4.2
-3.3
5.8
68.8
68.4
128.6
MET-23
ARG-24
4.2
4.2
-3.3
5.8
68.8
68.4
128.6

Graph shows rotational transition at bending residues and can be used
to identify hinge bending residues.
Probably only informative for interdomain rotations greater than 20 degrees
Residue
iResidue
i+1Distance of hinge axis to residue i in
(A) Distance of hinge axis to residue i in
(A) Change in
(deg) Change in
(deg) Angle of psi(i) axis to hinge axis
(deg) Angle of psi(i) axis to hinge axis
(deg) Percentage Progress
MET-23
ARG-24
4.2
4.2
-3.3
5.8
68.8
68.4
128.6
MET-23
ARG-24
4.2
4.2
-3.3
5.8
68.8
68.4
128.6
ARG-24
LEU-25
5.2
5.4
4.4
0.1
71.4
73.3
-39.9
LEU-25
LEU-26
4.6
4.5
-12.3
7.4
159.0
153.9
-166.3

Graph shows rotational transition at bending residues and can be used
to identify hinge bending residues.
Probably only informative for interdomain rotations greater than 20 degrees
Residue
iResidue
i+1Distance of hinge axis to residue i in
(A) Distance of hinge axis to residue i in
(A) Change in
(deg) Change in
(deg) Angle of psi(i) axis to hinge axis
(deg) Angle of psi(i) axis to hinge axis
(deg) Percentage Progress
CYS-78
THR-79
13.6
13.7
-3.8
-4.7
135.3
134.7
-56.1
THR-79
GLY-80
14.4
14.4
0.3
4.2
30.7
30.6
76.3
GLY-80
VAL-81
11.7
11.7
3.8
-3.1
100.9
99.8
-20.0
VAL-81
PHE-82
10.2
10.3
-5.6
3.4
139.6
137.9
-33.6

Graph shows rotational transition at bending residues and can be used
to identify hinge bending residues.
Probably only informative for interdomain rotations greater than 20 degrees
Residue
iResidue
i+1Distance of hinge axis to residue i in
(A) Distance of hinge axis to residue i in
(A) Change in
(deg) Change in
(deg) Angle of psi(i) axis to hinge axis
(deg) Angle of psi(i) axis to hinge axis
(deg) Percentage Progress
ILE-134
GLN-135
13.9
14.1
-2.0
-8.4
143.3
143.7
-282.8
GLN-135
GLU-136
14.9
15.0
1.2
0.1
58.8
53.7
7.5
GLU-136
HIS-137
16.7
16.6
-5.5
7.1
121.1
118.9
122.3

Graph shows rotational transition at bending residues and can be used
to identify hinge bending residues.
Probably only informative for interdomain rotations greater than 20 degrees
Residue
iResidue
i+1Distance of hinge axis to residue i in
(A) Distance of hinge axis to residue i in
(A) Change in
(deg) Change in
(deg) Angle of psi(i) axis to hinge axis
(deg) Angle of psi(i) axis to hinge axis
(deg) Percentage Progress
TYR-142
ASP-143
3.4
3.4
-4.0
10.7
118.3
118.3
114.4
ASP-143
GLU-144
3.1
3.3
7.6
-6.5
62.2
61.6
-159.6
GLU-144
SER-145
6.1
6.3
3.0
-3.3
118.7
119.1
127.2

Graph shows rotational transition at bending residues and can be used
to identify hinge bending residues.
Probably only informative for interdomain rotations greater than 20 degrees
Residue
iResidue
i+1Distance of hinge axis to residue i in
(A) Distance of hinge axis to residue i in
(A) Change in
(deg) Change in
(deg) Angle of psi(i) axis to hinge axis
(deg) Angle of psi(i) axis to hinge axis
(deg) Percentage Progress
THR-187
ILE-188
8.3
8.3
3.1
1.3
71.9
71.5
108.0
ILE-188
ILE-189
4.6
4.6
3.7
-3.4
73.4
71.4
-10.9
ILE-189
PRO-190
4.4
4.5
1.5
-5.1
90.4
89.7
1.5

Graph shows rotational transition at bending residues and can be used
to identify hinge bending residues.
Probably only informative for interdomain rotations greater than 20 degrees
Residue
iResidue
i+1Distance of hinge axis to residue i in
(A) Distance of hinge axis to residue i in
(A) Change in
(deg) Change in
(deg) Angle of psi(i) axis to hinge axis
(deg) Angle of psi(i) axis to hinge axis
(deg) Percentage Progress
PHE-228
VAL-229
9.7
9.7
1.2
3.4
68.0
65.8
-39.2
VAL-229
HIS-230
7.9
7.8
0.8
0.5
22.5
22.9
22.3
HIS-230
LEU-231
9.3
9.4
-1.8
2.5
131.8
134.2
87.2
LEU-231
ASP-232
7.6
7.7
3.2
-3.3
68.9
69.3
-26.1
ASP-232
ASP-233
7.7
7.7
-1.6
-1.0
50.5
51.3
-87.3
ASP-233
LEU-234
7.2
7.1
-4.7
8.0
87.6
88.9
179.7

Graph shows rotational transition at bending residues and can be used
to identify hinge bending residues.
Probably only informative for interdomain rotations greater than 20 degrees
Residue
iResidue
i+1Distance of hinge axis to residue i in
(A) Distance of hinge axis to residue i in
(A) Change in
(deg) Change in
(deg) Angle of psi(i) axis to hinge axis
(deg) Angle of psi(i) axis to hinge axis
(deg) Percentage Progress
ARG-250
TYR-251
8.2
8.4
1.6
-3.8
79.9
82.6
1.3
TYR-251
ILE-252
4.9
5.0
-1.2
2.0
87.3
89.0
187.3
ILE-252
CYS-253
1.5
1.7
2.4
-0.1
118.2
122.0
-117.7
CYS-253
SER-254
1.6
1.4
-4.7
0.0
99.3
101.2
2.2
SER-254
SER-255
4.7
4.6
-10.5
9.2
111.5
111.7
81.4
SER-255
HIS-256
7.9
7.9
-7.2
8.1
129.5
130.4
43.3
HIS-256
ASP-257
10.2
10.2
1.2
-1.5
62.9
61.8
-116.1

Graph shows rotational transition at bending residues and can be used
to identify hinge bending residues.
Probably only informative for interdomain rotations greater than 20 degrees
Residue
iResidue
i+1Distance of hinge axis to residue i in
(A) Distance of hinge axis to residue i in
(A) Change in
(deg) Change in
(deg) Angle of psi(i) axis to hinge axis
(deg) Angle of psi(i) axis to hinge axis
(deg) Percentage Progress
VAL-290
CYS-291
9.0
8.9
8.9
-5.2
41.0
43.9
102.1
CYS-291
PHE-292
6.3
6.1
-1.3
2.4
111.9
112.0
-122.3
PHE-292
SER-293
3.6
3.5
-1.3
-1.7
95.6
97.4
-9.1
SER-293
SER-294
2.3
2.3
-0.3
2.7
143.0
142.4
120.9
SER-294
LYS-295
3.7
3.6
-3.0
-1.4
77.4
79.1
-112.8
LYS-295
LYS-296
6.5
6.5
4.9
-0.3
62.5
64.7
206.0

Graph shows rotational transition at bending residues and can be used
to identify hinge bending residues.
Probably only informative for interdomain rotations greater than 20 degrees
Residue
iResidue
i+1Distance of hinge axis to residue i in
(A) Distance of hinge axis to residue i in
(A) Change in
(deg) Change in
(deg) Angle of psi(i) axis to hinge axis
(deg) Angle of psi(i) axis to hinge axis
(deg) Percentage Progress
GLU-303
PHE-304
11.5
11.4
-13.6
15.3
60.7
66.5
-127.5
PHE-304
LYS-305
10.4
10.2
12.3
-32.4
105.3
105.4
107.2
LYS-305
TYR-306
13.3
13.1
7.2
-5.0
78.6
87.7
5.3
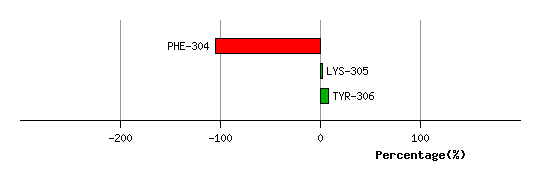
Graph shows rotational transition at bending residues and can be used
to identify hinge bending residues.
Probably only informative for interdomain rotations greater than 20 degrees