6-Phosphogluconate Dehydrogenase, Decarboxylating
(All numbering and residues are taken from first PDB file)
![]()
![]()
Bending Residue Dihedral Analysis
Residue
iResidue
i+1Distance of hinge axis to residue i in
(A) Distance of hinge axis to residue i in
(A) Change in
(deg) Change in
(deg) Angle of psi(i) axis to hinge axis
(deg) Angle of psi(i) axis to hinge axis
(deg) Percentage Progress
ILE-97
ILE-98
9.0
9.3
-6.5
-1.2
59.7
61.2
56.5
ILE-98
ASP-99
6.3
6.5
-5.6
8.5
90.9
93.3
-2.9
ASP-99
GLY-100
4.6
4.7
-3.2
-1.3
38.8
39.7
55.3

Graph shows rotational transition at bending residues and can be used
to identify hinge bending residues.
Probably only informative for interdomain rotations greater than 20 degrees
Residue
iResidue
i+1Distance of hinge axis to residue i in
(A) Distance of hinge axis to residue i in
(A) Change in
(deg) Change in
(deg) Angle of psi(i) axis to hinge axis
(deg) Angle of psi(i) axis to hinge axis
(deg) Percentage Progress
ARG-110
ARG-111
1.8
1.6
1.2
0.7
80.5
76.3
18.1
ARG-111
ASN-112
1.7
1.7
0.3
-0.3
80.7
77.6
9.9
ASN-112
ARG-113
4.0
4.0
1.3
5.2
148.5
147.6
-41.1
ARG-113
GLU-114
5.0
5.1
-4.6
-0.4
55.7
63.8
38.1
GLU-114
LEU-115
4.4
4.9
-2.5
-2.8
111.6
118.4
2.2
LEU-115
SER-116
7.1
7.3
2.9
-8.0
92.6
84.8
25.0
SER-116
ALA-117
9.0
9.2
2.0
1.2
153.5
151.3
-27.2
ALA-117
GLU-118
9.4
9.8
-8.9
13.2
85.0
83.1
12.0

Graph shows rotational transition at bending residues and can be used
to identify hinge bending residues.
Probably only informative for interdomain rotations greater than 20 degrees
Residue
iResidue
i+1Distance of hinge axis to residue i in
(A) Distance of hinge axis to residue i in
(A) Change in
(deg) Change in
(deg) Angle of psi(i) axis to hinge axis
(deg) Angle of psi(i) axis to hinge axis
(deg) Percentage Progress
ASN-121
PHE-122
10.0
11.1
-31.4
23.3
70.4
70.7
99.3
PHE-122
ILE-123
6.4
7.4
18.9
-17.5
132.5
131.0
52.8
ILE-123
GLY-124
5.0
5.3
5.6
-7.8
100.5
92.5
2.2
GLY-124
THR-125
1.2
1.5
-6.1
0.6
22.1
27.6
40.6

Graph shows rotational transition at bending residues and can be used
to identify hinge bending residues.
Probably only informative for interdomain rotations greater than 20 degrees
Residue
iResidue
i+1Distance of hinge axis to residue i in
(A) Distance of hinge axis to residue i in
(A) Change in
(deg) Change in
(deg) Angle of psi(i) axis to hinge axis
(deg) Angle of psi(i) axis to hinge axis
(deg) Percentage Progress
GLY-126
VAL-127
2.6
2.7
-1.2
-1.3
151.3
151.1
-16.2
VAL-127
SER-128
2.9
2.9
4.8
-8.7
60.4
62.0
-21.7
SER-128
GLY-129
5.2
5.3
-5.7
20.6
159.2
161.9
138.4
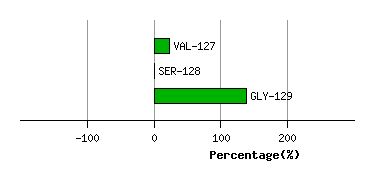
Graph shows rotational transition at bending residues and can be used
to identify hinge bending residues.
Probably only informative for interdomain rotations greater than 20 degrees
Residue
iResidue
i+1Distance of hinge axis to residue i in
(A) Distance of hinge axis to residue i in
(A) Change in
(deg) Change in
(deg) Angle of psi(i) axis to hinge axis
(deg) Angle of psi(i) axis to hinge axis
(deg) Percentage Progress
PRO-138
SER-139
1.8
1.9
1.1
6.7
77.1
75.2
43.0
SER-139
ILE-140
2.4
2.4
6.3
-9.8
21.3
23.7
-33.8
ILE-140
MET-141
2.0
1.9
-3.3
-0.8
124.8
123.6
-54.0

Graph shows rotational transition at bending residues and can be used
to identify hinge bending residues.
Probably only informative for interdomain rotations greater than 20 degrees
Residue
iResidue
i+1Distance of hinge axis to residue i in
(A) Distance of hinge axis to residue i in
(A) Change in
(deg) Change in
(deg) Angle of psi(i) axis to hinge axis
(deg) Angle of psi(i) axis to hinge axis
(deg) Percentage Progress
GLY-143
GLY-144
6.2
6.1
8.4
-6.8
135.5
134.5
-27.8
GLY-144
GLN-145
7.3
7.4
-8.9
-4.2
85.8
85.7
17.8
GLN-145
LYS-146
10.8
10.9
12.2
1.5
25.2
25.4
135.5
LYS-146
GLU-147
13.1
13.1
6.1
5.6
73.8
82.7
56.0
GLU-147
ALA-148
15.1
14.8
-5.5
2.0
105.5
105.4
5.3
ALA-148
TYR-149
12.5
11.7
-2.7
-2.9
156.0
162.6
-36.3
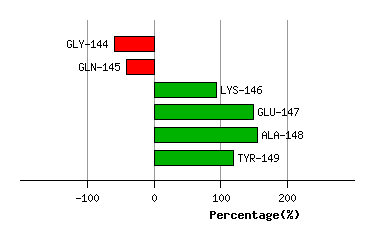
Graph shows rotational transition at bending residues and can be used
to identify hinge bending residues.
Probably only informative for interdomain rotations greater than 20 degrees
Residue
iResidue
i+1Distance of hinge axis to residue i in
(A) Distance of hinge axis to residue i in
(A) Change in
(deg) Change in
(deg) Angle of psi(i) axis to hinge axis
(deg) Angle of psi(i) axis to hinge axis
(deg) Percentage Progress
VAL-152
ALA-153
11.9
11.3
0.6
1.0
147.9
147.2
5.5
ALA-153
PRO-154
11.5
11.1
0.4
-2.1
150.1
148.9
26.0
PRO-154
ILE-155
13.4
13.0
-6.1
-3.6
73.9
73.4
57.2
ILE-155
LEU-156
11.5
11.2
7.3
1.8
102.3
99.0
-47.1
LEU-156
THR-157
7.9
7.6
1.7
1.2
148.7
153.4
-72.3
THR-157
LYS-158
8.9
8.6
-5.1
7.2
38.1
42.4
8.8

Graph shows rotational transition at bending residues and can be used
to identify hinge bending residues.
Probably only informative for interdomain rotations greater than 20 degrees
Residue
iResidue
i+1Distance of hinge axis to residue i in
(A) Distance of hinge axis to residue i in
(A) Change in
(deg) Change in
(deg) Angle of psi(i) axis to hinge axis
(deg) Angle of psi(i) axis to hinge axis
(deg) Percentage Progress
ILE-159
ALA-160
6.9
6.8
1.7
-6.1
97.6
97.7
-8.5
ALA-160
ALA-161
3.9
3.7
2.1
0.5
159.1
162.0
-7.9
ALA-161
VAL-162
1.9
1.8
1.8
-9.4
105.3
102.3
104.8

Graph shows rotational transition at bending residues and can be used
to identify hinge bending residues.
Probably only informative for interdomain rotations greater than 20 degrees