Transcription Elongation Protein Nusa
(All numbering and residues are taken from first PDB file)
![]()
![]()
Bending Residue Dihedral Analysis
Residue
iResidue
i+1Distance of hinge axis to residue i in
(A) Distance of hinge axis to residue i in
(A) Change in
(deg) Change in
(deg) Angle of psi(i) axis to hinge axis
(deg) Angle of psi(i) axis to hinge axis
(deg) Percentage Progress
SER-204
VAL-205
3.2
3.3
1.2
-2.5
123.1
120.4
-0.2
VAL-205
GLU-206
1.8
1.8
2.5
-3.5
120.2
117.7
36.3
GLU-206
ILE-207
4.9
5.0
1.2
-4.5
147.1
145.7
-21.6

Graph shows rotational transition at bending residues and can be used
to identify hinge bending residues.
Probably only informative for interdomain rotations greater than 20 degrees
Residue
iResidue
i+1Distance of hinge axis to residue i in
(A) Distance of hinge axis to residue i in
(A) Change in
(deg) Change in
(deg) Angle of psi(i) axis to hinge axis
(deg) Angle of psi(i) axis to hinge axis
(deg) Percentage Progress
VAL-222
ARG-223
5.3
5.4
4.0
-4.0
157.2
153.9
-104.6
ARG-223
SER-224
5.4
5.6
-9.1
-6.2
55.6
56.2
162.9
SER-224
ASN-225
3.1
3.1
1.9
-1.8
140.1
147.4
-53.9

Graph shows rotational transition at bending residues and can be used
to identify hinge bending residues.
Probably only informative for interdomain rotations greater than 20 degrees
Residue
iResidue
i+1Distance of hinge axis to residue i in
(A) Distance of hinge axis to residue i in
(A) Change in
(deg) Change in
(deg) Angle of psi(i) axis to hinge axis
(deg) Angle of psi(i) axis to hinge axis
(deg) Percentage Progress
LEU-229
ASN-230
5.4
5.6
-23.6
23.3
38.9
42.0
-43.6
ASN-230
ALA-231
6.8
7.0
2.2
5.8
139.4
132.1
8.8
ALA-231
LYS-232
4.1
4.1
-3.8
2.1
19.9
16.5
36.8
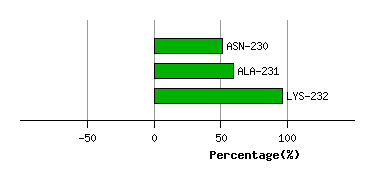
Graph shows rotational transition at bending residues and can be used
to identify hinge bending residues.
Probably only informative for interdomain rotations greater than 20 degrees
Residue
iResidue
i+1Distance of hinge axis to residue i in
(A) Distance of hinge axis to residue i in
(A) Change in
(deg) Change in
(deg) Angle of psi(i) axis to hinge axis
(deg) Angle of psi(i) axis to hinge axis
(deg) Percentage Progress
GLY-233
ALA-234
8.0
7.8
9.6
-11.7
81.8
85.4
-35.1
ALA-234
CYS-235
5.9
5.6
-2.7
10.2
152.7
152.6
91.1
CYS-235
ILE-236
3.9
3.6
2.2
-3.4
40.7
41.0
-14.5
ILE-236
GLY-237
7.0
6.7
7.9
19.4
92.0
92.3
4.2
GLY-237
PRO-238
9.6
9.2
-20.5
14.6
103.4
83.7
-49.2
PRO-238
MET-239
13.4
12.8
-160.5
-175.9
171.4
144.1
316.5
MET-239
GLY-240
14.3
14.1
-1.6
1.2
119.5
134.6
-52.4
GLY-240
GLN-241
10.5
10.7
-11.6
-11.1
113.1
119.6
-164.3
GLN-241
ARG-242
11.0
10.6
13.5
-6.8
96.0
96.4
-27.3

Graph shows rotational transition at bending residues and can be used
to identify hinge bending residues.
Probably only informative for interdomain rotations greater than 20 degrees
Residue
iResidue
i+1Distance of hinge axis to residue i in
(A) Distance of hinge axis to residue i in
(A) Change in
(deg) Change in
(deg) Angle of psi(i) axis to hinge axis
(deg) Angle of psi(i) axis to hinge axis
(deg) Percentage Progress
ILE-257
ILE-258
6.2
6.0
-7.7
6.7
123.7
124.2
-41.5
ILE-258
ASP-259
8.9
8.8
6.4
-7.7
14.5
14.7
12.0
ASP-259
TYR-260
9.3
9.3
-0.5
-6.9
97.5
99.7
42.4

Graph shows rotational transition at bending residues and can be used
to identify hinge bending residues.
Probably only informative for interdomain rotations greater than 20 degrees