Autolysin
(All numbering and residues are taken from first PDB file)
![]()
![]()
Bending Residue Dihedral Analysis
Residue
iResidue
i+1Distance of hinge axis to residue i in
(A) Distance of hinge axis to residue i in
(A) Change in
(deg) Change in
(deg) Angle of psi(i) axis to hinge axis
(deg) Angle of psi(i) axis to hinge axis
(deg) Percentage Progress
THR-259
GLY-260
7.6
7.7
-6.2
-13.9
10.1
15.7
134.7
GLY-260
TRP-261
6.4
6.4
-9.8
15.0
60.1
53.5
-43.7
TRP-261
VAL-262
5.4
5.5
-9.2
7.6
95.8
87.7
-0.4
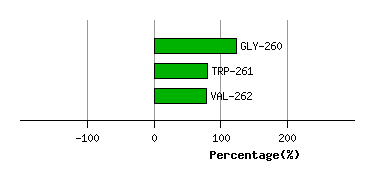
Graph shows rotational transition at bending residues and can be used
to identify hinge bending residues.
Probably only informative for interdomain rotations greater than 20 degrees
Residue
iResidue
i+1Distance of hinge axis to residue i in
(A) Distance of hinge axis to residue i in
(A) Change in
(deg) Change in
(deg) Angle of psi(i) axis to hinge axis
(deg) Angle of psi(i) axis to hinge axis
(deg) Percentage Progress
TRP-268
TYR-269
5.2
4.8
-6.6
9.2
32.3
34.6
-23.2
TYR-269
TYR-270
3.8
3.7
0.2
-2.1
104.5
110.3
26.9
TYR-270
LEU-271
1.6
1.6
-24.2
21.1
3.6
0.7
17.1
LEU-271
ASP-272
3.0
3.0
25.6
-18.4
106.9
107.3
6.8
ASP-272
ALA-273
4.2
3.9
17.4
3.1
96.7
89.3
-16.8

Graph shows rotational transition at bending residues and can be used
to identify hinge bending residues.
Probably only informative for interdomain rotations greater than 20 degrees
Residue
iResidue
i+1Distance of hinge axis to residue i in
(A) Distance of hinge axis to residue i in
(A) Change in
(deg) Change in
(deg) Angle of psi(i) axis to hinge axis
(deg) Angle of psi(i) axis to hinge axis
(deg) Percentage Progress
ALA-277
MET-278
1.6
1.7
-6.9
-2.2
23.9
21.5
47.9
MET-278
VAL-279
2.2
2.6
2.6
-2.5
94.2
96.5
16.9
VAL-279
SER-280
2.9
2.9
-4.4
-4.3
58.0
57.1
39.9
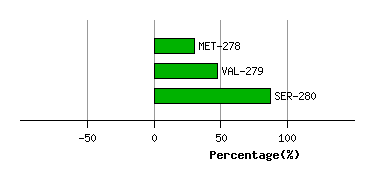
Graph shows rotational transition at bending residues and can be used
to identify hinge bending residues.
Probably only informative for interdomain rotations greater than 20 degrees