Cytosine Deaminase
(All numbering and residues are taken from first PDB file)
![]()
![]()
Bending Residue Dihedral Analysis
Residue
iResidue
i+1Distance of hinge axis to residue i in
(A) Distance of hinge axis to residue i in
(A) Change in
(deg) Change in
(deg) Angle of psi(i) axis to hinge axis
(deg) Angle of psi(i) axis to hinge axis
(deg) Percentage Progress
HIS-63
LEU-64
6.6
6.5
-2.4
2.5
124.8
123.9
1.9
LEU-64
ASP-65
5.0
4.8
-2.6
6.0
131.8
130.8
6.5
ASP-65
THR-66
4.8
4.6
-0.6
-4.3
66.0
68.4
17.3
THR-66
THR-67
4.2
3.8
5.4
-2.8
114.9
115.6
-7.4
THR-67
GLN-68
0.6
0.3
9.1
-2.1
67.3
67.5
33.4
GLN-68
THR-69
3.4
3.7
0.1
6.0
73.5
73.2
-1.2
THR-69
ALA-70
5.6
5.7
-5.0
-5.2
42.0
44.8
42.5

Graph shows rotational transition at bending residues and can be used
to identify hinge bending residues.
Probably only informative for interdomain rotations greater than 20 degrees
Residue
iResidue
i+1Distance of hinge axis to residue i in
(A) Distance of hinge axis to residue i in
(A) Change in
(deg) Change in
(deg) Angle of psi(i) axis to hinge axis
(deg) Angle of psi(i) axis to hinge axis
(deg) Percentage Progress
ARG-91
LYS-92
10.7
11.7
35.0
14.8
135.7
143.4
-167.7
LYS-92
ALA-93
10.7
12.0
-5.8
5.9
28.4
25.0
-3.4
ALA-93
LEU-94
13.0
12.2
-5.9
12.1
58.2
81.8
-6.8
LEU-94
LEU-95
10.7
9.0
-12.9
-13.5
75.3
89.3
14.2
LEU-95
THR-96
7.4
7.0
-51.1
9.3
16.2
24.4
182.9
THR-96
HIS-97
5.1
5.0
15.8
-1.0
83.0
85.4
28.7
HIS-97
ASP-98
2.7
2.7
-0.5
2.0
111.3
109.0
11.7
ASP-98
ASP-99
1.2
1.2
-1.0
-7.3
160.4
159.9
-46.7
ASP-99
VAL-100
2.6
2.6
7.1
1.2
49.7
48.8
40.4
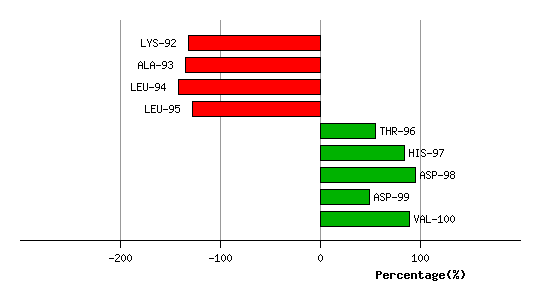
Graph shows rotational transition at bending residues and can be used
to identify hinge bending residues.
Probably only informative for interdomain rotations greater than 20 degrees
Residue
iResidue
i+1Distance of hinge axis to residue i in
(A) Distance of hinge axis to residue i in
(A) Change in
(deg) Change in
(deg) Angle of psi(i) axis to hinge axis
(deg) Angle of psi(i) axis to hinge axis
(deg) Percentage Progress
ASP-313
GLY-314
6.9
6.8
1.8
-10.6
53.9
49.2
-23.3
GLY-314
VAL-315
3.4
3.4
0.6
-1.8
97.7
99.9
18.1
VAL-315
PHE-316
1.5
1.5
13.2
3.2
63.1
64.1
92.0
PHE-316
ASP-317
2.9
3.3
-6.4
-2.8
126.9
126.1
-34.1
ASP-317
PRO-318
4.0
4.2
-4.0
-7.7
59.0
55.0
24.0
PRO-318
TRP-319
7.6
7.6
2.1
15.0
158.3
143.0
-68.4
TRP-319
TYR-320
6.8
6.8
-22.5
9.7
54.9
44.3
14.7
TYR-320
PRO-321
3.5
3.6
-4.9
4.8
110.6
113.2
-3.7
PRO-321
LEU-322
4.9
5.0
-15.5
23.4
82.5
81.8
-17.3
LEU-322
GLY-323
3.9
4.1
-4.7
-3.4
116.3
116.1
-23.1
GLY-323
THR-324
4.6
4.7
1.3
-1.2
53.8
51.4
0.2

Graph shows rotational transition at bending residues and can be used
to identify hinge bending residues.
Probably only informative for interdomain rotations greater than 20 degrees