P58-Cl42 Kir
(All numbering and residues are taken from first PDB file)
![]()
![]()
Bending Residue Dihedral Analysis
Residue
iResidue
i+1Distance of hinge axis to residue i in
(A) Distance of hinge axis to residue i in
(A) Change in
(deg) Change in
(deg) Angle of psi(i) axis to hinge axis
(deg) Angle of psi(i) axis to hinge axis
(deg) Percentage Progress
HIS-13
PRO-14
3.4
3.6
9.1
9.0
76.2
82.5
-21.6
PRO-14
GLY-15
5.3
5.4
-6.3
5.2
141.9
141.0
-6.5
GLY-15
PRO-16
5.7
5.6
14.9
0.5
44.7
44.0
89.7

Graph shows rotational transition at bending residues and can be used
to identify hinge bending residues.
Probably only informative for interdomain rotations greater than 20 degrees
Residue
iResidue
i+1Distance of hinge axis to residue i in
(A) Distance of hinge axis to residue i in
(A) Change in
(deg) Change in
(deg) Angle of psi(i) axis to hinge axis
(deg) Angle of psi(i) axis to hinge axis
(deg) Percentage Progress
LEU-17
VAL-18
5.0
4.9
-23.0
33.1
120.2
119.0
72.1
VAL-18
LYS-19
4.8
4.4
6.2
-10.7
120.5
123.1
14.4
LYS-19
SER-20
8.1
7.8
6.8
-10.8
91.2
92.6
2.5
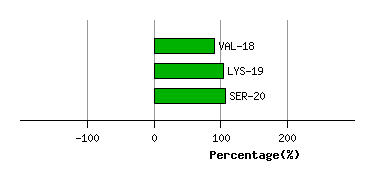
Graph shows rotational transition at bending residues and can be used
to identify hinge bending residues.
Probably only informative for interdomain rotations greater than 20 degrees
Residue
iResidue
i+1Distance of hinge axis to residue i in
(A) Distance of hinge axis to residue i in
(A) Change in
(deg) Change in
(deg) Angle of psi(i) axis to hinge axis
(deg) Angle of psi(i) axis to hinge axis
(deg) Percentage Progress
SER-67
ARG-68
8.7
9.0
-12.2
11.2
133.8
137.3
6.4
ARG-68
MET-69
9.7
10.1
1.2
-2.0
36.9
35.4
2.7
MET-69
THR-70
7.1
7.6
14.4
-7.1
31.7
33.6
43.9
THR-70
GLN-71
8.7
9.1
10.2
-2.3
131.9
134.2
-37.0
THR-70
GLN-71
8.7
9.1
10.2
-2.3
131.9
134.2
-37.0

Graph shows rotational transition at bending residues and can be used
to identify hinge bending residues.
Probably only informative for interdomain rotations greater than 20 degrees
Residue
iResidue
i+1Distance of hinge axis to residue i in
(A) Distance of hinge axis to residue i in
(A) Change in
(deg) Change in
(deg) Angle of psi(i) axis to hinge axis
(deg) Angle of psi(i) axis to hinge axis
(deg) Percentage Progress
THR-70
GLN-71
8.7
9.1
10.2
-2.3
131.9
134.2
-37.0
THR-70
GLN-71
8.7
9.1
10.2
-2.3
131.9
134.2
-37.0
GLN-71
ASP-72
7.4
7.8
-21.9
12.1
94.3
94.1
74.0
ASP-72
LEU-73
9.5
9.5
10.5
-6.9
50.4
47.6
26.4

Graph shows rotational transition at bending residues and can be used
to identify hinge bending residues.
Probably only informative for interdomain rotations greater than 20 degrees
Residue
iResidue
i+1Distance of hinge axis to residue i in
(A) Distance of hinge axis to residue i in
(A) Change in
(deg) Change in
(deg) Angle of psi(i) axis to hinge axis
(deg) Angle of psi(i) axis to hinge axis
(deg) Percentage Progress
LEU-97
ASP-98
8.6
8.7
4.1
-3.6
58.1
58.0
-1.5
ASP-98
ILE-99
5.7
5.8
7.8
-9.7
121.4
120.9
-2.4
ILE-99
VAL-100
2.4
2.4
-5.8
14.4
138.7
136.1
66.7

Graph shows rotational transition at bending residues and can be used
to identify hinge bending residues.
Probably only informative for interdomain rotations greater than 20 degrees