Hypothetical Transcriptional Regulator In Qaca 5'Region
(All numbering and residues are taken from first PDB file)
![]()
![]()
Bending Residue Dihedral Analysis
Residue
iResidue
i+1Distance of hinge axis to residue i in
(A) Distance of hinge axis to residue i in
(A) Change in
(deg) Change in
(deg) Angle of psi(i) axis to hinge axis
(deg) Angle of psi(i) axis to hinge axis
(deg) Percentage Progress
GLU-58
SER-59
0.9
1.7
16.4
-5.8
20.4
24.9
27.0
SER-59
LYS-60
3.4
4.2
-3.6
-0.1
126.2
135.5
2.7
LYS-60
TRP-61
4.4
3.7
-31.0
42.7
112.3
105.5
3.2
TRP-61
GLN-62
2.3
0.8
13.5
-15.7
53.9
55.0
-12.6
GLN-62
GLU-63
1.5
2.8
-13.8
11.1
157.5
159.2
-4.4
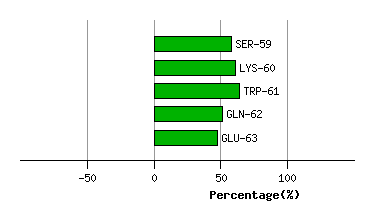
Graph shows rotational transition at bending residues and can be used
to identify hinge bending residues.
Probably only informative for interdomain rotations greater than 20 degrees
Residue
iResidue
i+1Distance of hinge axis to residue i in
(A) Distance of hinge axis to residue i in
(A) Change in
(deg) Change in
(deg) Angle of psi(i) axis to hinge axis
(deg) Angle of psi(i) axis to hinge axis
(deg) Percentage Progress
LEU-87
THR-88
14.3
13.8
-24.2
19.7
66.6
81.6
2.2
THR-88
THR-89
13.5
14.0
-27.5
1.1
101.2
108.0
-34.7
THR-89
GLU-90
10.1
10.8
162.4
50.9
45.7
11.5
-340.8
GLU-90
TYR-91
10.3
11.1
-29.3
68.9
124.2
101.8
-6.9
TYR-91
TYR-92
6.7
14.7
-175.8
172.5
121.2
94.9
39.6
TYR-92
TYR-93
5.2
14.2
97.4
-39.2
70.7
80.7
139.6
TYR-93
PRO-94
8.4
10.9
152.0
-8.4
58.8
30.9
323.8
PRO-94
LEU-95
10.6
12.0
6.0
29.4
11.8
40.1
89.9
LEU-95
GLN-96
8.9
8.9
-71.1
35.4
111.9
119.8
-55.4

Graph shows rotational transition at bending residues and can be used
to identify hinge bending residues.
Probably only informative for interdomain rotations greater than 20 degrees
Residue
iResidue
i+1Distance of hinge axis to residue i in
(A) Distance of hinge axis to residue i in
(A) Change in
(deg) Change in
(deg) Angle of psi(i) axis to hinge axis
(deg) Angle of psi(i) axis to hinge axis
(deg) Percentage Progress
TYR-107
LYS-108
5.9
5.8
19.8
-1.4
124.0
139.7
-23.5
LYS-108
THR-109
6.9
6.7
-50.5
54.6
96.4
90.8
27.5
THR-109
ASN-110
6.7
6.1
38.9
-37.5
25.5
44.4
12.6
ASN-110
SER-111
9.4
9.3
13.2
-8.7
41.4
49.6
19.9
SER-111
ILE-112
8.8
8.8
-11.2
0.2
126.7
140.4
-18.6

Graph shows rotational transition at bending residues and can be used
to identify hinge bending residues.
Probably only informative for interdomain rotations greater than 20 degrees