Glutamate Receptor, Ionotropic Kainate 1
(All numbering and residues are taken from first PDB file)
![]()
![]()
Bending Residue Dihedral Analysis
Residue
iResidue
i+1Distance of hinge axis to residue i in
(A) Distance of hinge axis to residue i in
(A) Change in
(deg) Change in
(deg) Angle of psi(i) axis to hinge axis
(deg) Angle of psi(i) axis to hinge axis
(deg) Percentage Progress
THR-107
LEU-108
7.5
6.6
25.7
-20.6
110.8
117.3
-77.6
LEU-108
GLY-109
6.0
5.4
-5.7
7.3
140.1
139.3
12.6
GLY-109
ILE-110
6.7
6.4
-4.3
0.9
68.2
68.6
37.2
ILE-110
SER-111
7.8
7.7
-2.9
4.0
68.4
69.1
15.3

Graph shows rotational transition at bending residues and can be used
to identify hinge bending residues.
Probably only informative for interdomain rotations greater than 20 degrees
Residue
iResidue
i+1Distance of hinge axis to residue i in
(A) Distance of hinge axis to residue i in
(A) Change in
(deg) Change in
(deg) Angle of psi(i) axis to hinge axis
(deg) Angle of psi(i) axis to hinge axis
(deg) Percentage Progress
SER-213
LYS-214
7.6
7.2
10.7
-6.8
103.2
111.9
-22.1
LYS-214
GLY-215
4.7
4.5
6.2
7.5
36.6
39.9
98.1
GLY-215
TYR-216
5.0
4.8
-5.8
1.6
104.3
104.3
-3.5
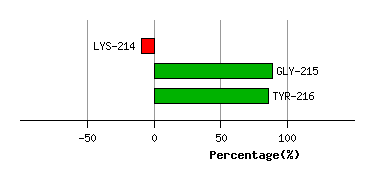
Graph shows rotational transition at bending residues and can be used
to identify hinge bending residues.
Probably only informative for interdomain rotations greater than 20 degrees
Residue
iResidue
i+1Distance of hinge axis to residue i in
(A) Distance of hinge axis to residue i in
(A) Change in
(deg) Change in
(deg) Angle of psi(i) axis to hinge axis
(deg) Angle of psi(i) axis to hinge axis
(deg) Percentage Progress
LYS-249
TRP-250
8.5
8.5
1.8
-5.6
90.3
90.0
29.4
TRP-250
TRP-251
5.1
5.1
6.9
-8.5
84.5
85.6
-38.5
TRP-251
ARG-252
4.6
4.5
13.5
8.8
140.6
143.8
-132.4
ARG-252
GLY-253
6.7
6.6
6.7
-43.5
130.5
127.4
-610.9
GLY-253
ASN-254
5.8
7.7
-19.7
33.8
31.5
87.0
-37.7
ASN-254
GLY-255
7.3
10.0
123.6
142.8
90.4
143.6
760.3
GLY-255
CYS-256
10.9
9.9
-157.7
-8.8
91.5
91.9
-54.3

Graph shows rotational transition at bending residues and can be used
to identify hinge bending residues.
Probably only informative for interdomain rotations greater than 20 degrees