Cytochrome P450
(All numbering and residues are taken from first PDB file)
![]()
![]()
Bending Residue Dihedral Analysis
Residue
iResidue
i+1Distance of hinge axis to residue i in
(A) Distance of hinge axis to residue i in
(A) Change in
(deg) Change in
(deg) Angle of psi(i) axis to hinge axis
(deg) Angle of psi(i) axis to hinge axis
(deg) Percentage Progress
ASP-208
ILE-209
6.2
6.8
3.5
-2.7
46.4
48.3
7.3
ILE-209
LYS-210
3.2
3.4
-14.5
22.1
124.7
123.0
19.8
LYS-210
VAL-211
6.4
6.1
-3.7
-6.2
137.2
137.6
-40.3
VAL-211
MET-212
7.8
8.0
4.1
-1.7
39.5
38.7
14.4
MET-212
ASN-213
4.7
5.4
15.9
-13.4
55.9
58.3
7.4
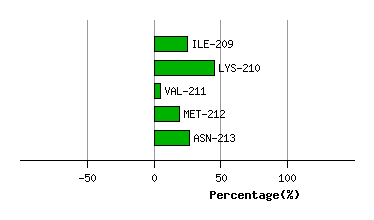
Graph shows rotational transition at bending residues and can be used
to identify hinge bending residues.
Probably only informative for interdomain rotations greater than 20 degrees
Residue
iResidue
i+1Distance of hinge axis to residue i in
(A) Distance of hinge axis to residue i in
(A) Change in
(deg) Change in
(deg) Angle of psi(i) axis to hinge axis
(deg) Angle of psi(i) axis to hinge axis
(deg) Percentage Progress
LEU-233
LEU-234
5.1
5.6
-17.8
5.0
101.5
108.0
-26.8
LEU-234
THR-235
1.9
2.2
8.1
-5.0
139.5
129.1
-25.8
THR-235
HIS-236
2.4
3.2
1.6
-10.8
91.5
77.5
-4.4
HIS-236
MET-237
5.9
6.8
10.1
5.7
47.5
29.0
46.2
MET-237
LEU-238
6.7
6.4
-15.6
5.2
80.1
82.8
-30.0
LEU-238
ASN-239
6.9
6.6
-8.8
-18.5
40.6
51.7
53.3

Graph shows rotational transition at bending residues and can be used
to identify hinge bending residues.
Probably only informative for interdomain rotations greater than 20 degrees