Acetolactate Synthase, Catabolic
(All numbering and residues are taken from first PDB file)
![]()
![]()
Bending Residue Dihedral Analysis
Residue
iResidue
i+1Distance of hinge axis to residue i in
(A) Distance of hinge axis to residue i in
(A) Change in
(deg) Change in
(deg) Angle of psi(i) axis to hinge axis
(deg) Angle of psi(i) axis to hinge axis
(deg) Percentage Progress
PRO-187
GLN-188
13.9
13.6
139.2
18.5
112.8
93.0
-602.4
GLN-188
MET-189
16.0
15.9
-18.7
-10.5
102.6
101.3
17.8
MET-189
GLY-190
13.8
13.9
-2.5
-13.7
70.6
60.1
207.3
GLY-190
ALA-191
15.9
16.3
6.3
15.2
140.4
127.0
-342.6
ALA-191
ALA-192
16.4
16.5
0.0
-1.3
65.6
59.0
-57.7

Graph shows rotational transition at bending residues and can be used
to identify hinge bending residues.
Probably only informative for interdomain rotations greater than 20 degrees
Residue
iResidue
i+1Distance of hinge axis to residue i in
(A) Distance of hinge axis to residue i in
(A) Change in
(deg) Change in
(deg) Angle of psi(i) axis to hinge axis
(deg) Angle of psi(i) axis to hinge axis
(deg) Percentage Progress
ALA-247
VAL-248
8.2
8.2
4.3
-1.9
47.3
47.3
-12.5
VAL-248
ASN-249
9.3
9.2
0.2
2.0
34.1
33.7
80.9
ASN-249
GLN-250
8.4
8.2
2.8
0.3
46.7
49.1
35.8
GLN-250
ASP-251
9.4
9.3
-9.9
15.7
110.2
108.6
-58.9

Graph shows rotational transition at bending residues and can be used
to identify hinge bending residues.
Probably only informative for interdomain rotations greater than 20 degrees
Residue
iResidue
i+1Distance of hinge axis to residue i in
(A) Distance of hinge axis to residue i in
(A) Change in
(deg) Change in
(deg) Angle of psi(i) axis to hinge axis
(deg) Angle of psi(i) axis to hinge axis
(deg) Percentage Progress
GLY-261
LEU-262
8.6
8.5
16.5
-18.2
53.4
53.5
-42.6
LEU-262
PHE-263
9.0
9.0
3.8
-3.5
42.0
36.9
3.4
PHE-263
ASN-264
10.1
10.0
-3.8
1.5
78.3
77.0
22.0
ASN-264
ASN-265
13.6
13.5
14.4
-7.0
56.7
59.0
154.1
ASN-265
GLN-266
13.1
13.2
-25.5
29.4
80.9
78.0
-129.2
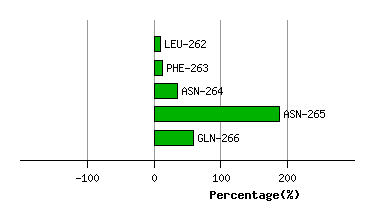
Graph shows rotational transition at bending residues and can be used
to identify hinge bending residues.
Probably only informative for interdomain rotations greater than 20 degrees
Residue
iResidue
i+1Distance of hinge axis to residue i in
(A) Distance of hinge axis to residue i in
(A) Change in
(deg) Change in
(deg) Angle of psi(i) axis to hinge axis
(deg) Angle of psi(i) axis to hinge axis
(deg) Percentage Progress
ARG-352
GLN-353
12.1
12.1
0.9
-1.2
44.1
43.4
40.6
GLN-353
HIS-354
12.2
12.2
4.2
0.9
34.9
35.7
46.8
HIS-354
GLN-355
12.3
12.4
-1.6
-10.8
79.8
84.9
55.7

Graph shows rotational transition at bending residues and can be used
to identify hinge bending residues.
Probably only informative for interdomain rotations greater than 20 degrees
Residue
iResidue
i+1Distance of hinge axis to residue i in
(A) Distance of hinge axis to residue i in
(A) Change in
(deg) Change in
(deg) Angle of psi(i) axis to hinge axis
(deg) Angle of psi(i) axis to hinge axis
(deg) Percentage Progress
ARG-403
TYR-404
4.0
3.9
0.1
2.1
115.2
116.3
-23.6
TYR-404
LEU-405
0.6
0.5
-2.1
-1.0
127.1
125.8
-68.1
LEU-405
TYR-406
1.6
1.8
7.7
-8.6
101.8
103.1
32.9
TYR-406
THR-407
4.3
4.4
6.9
2.0
132.8
136.3
-126.2

Graph shows rotational transition at bending residues and can be used
to identify hinge bending residues.
Probably only informative for interdomain rotations greater than 20 degrees
Residue
iResidue
i+1Distance of hinge axis to residue i in
(A) Distance of hinge axis to residue i in
(A) Change in
(deg) Change in
(deg) Angle of psi(i) axis to hinge axis
(deg) Angle of psi(i) axis to hinge axis
(deg) Percentage Progress
TYR-543
ARG-544
16.0
15.9
4.8
1.5
103.7
106.0
-45.6
ARG-544
ASP-545
17.4
17.1
-6.9
3.6
94.7
97.2
-21.9
ASP-545
ASN-546
14.4
14.2
-3.9
10.2
164.9
162.4
162.8

Graph shows rotational transition at bending residues and can be used
to identify hinge bending residues.
Probably only informative for interdomain rotations greater than 20 degrees