Hydrolase, Haloacid Dehalogenase Family
(All numbering and residues are taken from first PDB file)
![]()
![]()
Bending Residue Dihedral Analysis
Residue
iResidue
i+1Distance of hinge axis to residue i in
(A) Distance of hinge axis to residue i in
(A) Change in
(deg) Change in
(deg) Angle of psi(i) axis to hinge axis
(deg) Angle of psi(i) axis to hinge axis
(deg) Percentage Progress
ASP-4
TYR-5
12.0
12.0
9.9
2.3
21.1
24.7
212.9
TYR-5
GLN-6
10.2
10.3
-1.1
-3.6
97.7
101.1
-26.7
GLN-6
GLY-7
12.8
12.8
-0.8
-3.5
127.8
132.0
-31.3

Graph shows rotational transition at bending residues and can be used
to identify hinge bending residues.
Probably only informative for interdomain rotations greater than 20 degrees
Residue
iResidue
i+1Distance of hinge axis to residue i in
(A) Distance of hinge axis to residue i in
(A) Change in
(deg) Change in
(deg) Angle of psi(i) axis to hinge axis
(deg) Angle of psi(i) axis to hinge axis
(deg) Percentage Progress
LEU-38
PRO-39
15.3
15.1
-24.5
12.2
20.9
31.5
210.0
PRO-39
PHE-40
14.4
14.6
13.2
0.6
95.2
96.1
-126.3
PHE-40
LEU-41
11.7
11.8
14.4
-13.6
145.7
149.5
-20.9

Graph shows rotational transition at bending residues and can be used
to identify hinge bending residues.
Probably only informative for interdomain rotations greater than 20 degrees
Residue
iResidue
i+1Distance of hinge axis to residue i in
(A) Distance of hinge axis to residue i in
(A) Change in
(deg) Change in
(deg) Angle of psi(i) axis to hinge axis
(deg) Angle of psi(i) axis to hinge axis
(deg) Percentage Progress
THR-44
ASN-45
9.6
9.4
5.7
-0.4
23.4
25.3
94.8
ASN-45
ASN-46
9.5
9.5
-8.4
12.3
112.6
109.9
35.5
ASN-46
THR-47
13.2
13.2
14.3
-13.4
46.2
42.2
-18.1

Graph shows rotational transition at bending residues and can be used
to identify hinge bending residues.
Probably only informative for interdomain rotations greater than 20 degrees
Residue
iResidue
i+1Distance of hinge axis to residue i in
(A) Distance of hinge axis to residue i in
(A) Change in
(deg) Change in
(deg) Angle of psi(i) axis to hinge axis
(deg) Angle of psi(i) axis to hinge axis
(deg) Percentage Progress
TYR-72
THR-73
11.0
10.9
17.0
-11.7
102.5
100.6
-69.8
THR-73
ALA-74
10.6
10.6
-6.8
2.5
43.1
46.2
84.1
ALA-74
THR-75
8.4
8.3
-9.3
7.7
25.7
25.9
58.6

Graph shows rotational transition at bending residues and can be used
to identify hinge bending residues.
Probably only informative for interdomain rotations greater than 20 degrees
Residue
iResidue
i+1Distance of hinge axis to residue i in
(A) Distance of hinge axis to residue i in
(A) Change in
(deg) Change in
(deg) Angle of psi(i) axis to hinge axis
(deg) Angle of psi(i) axis to hinge axis
(deg) Percentage Progress
ILE-181
GLY-182
3.8
3.8
-5.0
-9.3
6.4
6.6
250.5
GLY-182
LYS-183
5.3
5.0
7.5
2.7
128.7
131.0
-158.2
LYS-183
PRO-184
4.5
4.6
-7.9
1.7
98.3
95.2
-59.4
PRO-184
LYS-185
4.7
4.6
-7.9
11.8
133.4
133.5
46.4
LYS-185
ALA-186
3.5
3.6
5.4
-9.0
95.1
95.2
4.9
ALA-186
ILE-187
3.2
3.1
2.2
-1.4
65.8
64.7
-26.1
ILE-187
ILE-188
1.8
1.7
0.2
1.6
125.9
125.7
-22.5
ILE-188
MET-189
3.0
2.9
1.8
-6.6
140.2
138.5
72.3
MET-189
GLU-190
2.9
3.0
8.4
-6.2
76.2
75.5
-23.0

Graph shows rotational transition at bending residues and can be used
to identify hinge bending residues.
Probably only informative for interdomain rotations greater than 20 degrees
Residue
iResidue
i+1Distance of hinge axis to residue i in
(A) Distance of hinge axis to residue i in
(A) Change in
(deg) Change in
(deg) Angle of psi(i) axis to hinge axis
(deg) Angle of psi(i) axis to hinge axis
(deg) Percentage Progress
ARG-191
ALA-192
7.3
7.2
-0.4
0.3
27.8
25.6
-2.0
ALA-192
ILE-193
7.3
7.1
6.2
-4.8
118.5
119.6
58.2
ILE-193
ALA-194
8.7
8.6
-7.3
3.1
117.4
112.6
-25.2

Graph shows rotational transition at bending residues and can be used
to identify hinge bending residues.
Probably only informative for interdomain rotations greater than 20 degrees
Residue
iResidue
i+1Distance of hinge axis to residue i in
(A) Distance of hinge axis to residue i in
(A) Change in
(deg) Change in
(deg) Angle of psi(i) axis to hinge axis
(deg) Angle of psi(i) axis to hinge axis
(deg) Percentage Progress
HIS-195
LEU-196
12.4
12.5
14.4
-19.6
14.9
13.0
-101.0
LEU-196
GLY-197
11.9
11.9
17.1
-27.9
85.5
82.0
-37.8
GLY-197
VAL-198
14.5
14.5
-18.5
34.2
119.4
127.8
215.4
VAL-198
GLU-199
13.8
13.9
-9.2
17.8
68.2
66.7
-4.3
GLU-199
LYS-200
12.8
13.6
0.1
-13.9
53.7
67.1
-167.3
LYS-200
GLU-201
10.0
10.6
5.8
-22.9
26.6
27.2
-322.0
GLU-201
GLN-202
12.1
11.9
23.8
-1.8
36.6
34.7
402.5

Graph shows rotational transition at bending residues and can be used
to identify hinge bending residues.
Probably only informative for interdomain rotations greater than 20 degrees
Residue
iResidue
i+1Distance of hinge axis to residue i in
(A) Distance of hinge axis to residue i in
(A) Change in
(deg) Change in
(deg) Angle of psi(i) axis to hinge axis
(deg) Angle of psi(i) axis to hinge axis
(deg) Percentage Progress
MET-205
VAL-206
1.8
1.9
3.9
-3.2
40.9
42.4
21.7
VAL-206
GLY-207
3.2
3.3
-3.0
1.9
67.4
68.4
17.7
GLY-207
ASP-208
5.8
5.8
2.8
-0.1
57.3
58.1
44.3
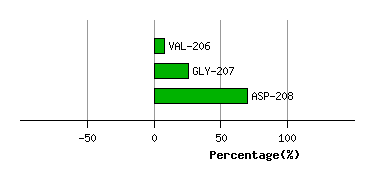
Graph shows rotational transition at bending residues and can be used
to identify hinge bending residues.
Probably only informative for interdomain rotations greater than 20 degrees
Residue
iResidue
i+1Distance of hinge axis to residue i in
(A) Distance of hinge axis to residue i in
(A) Change in
(deg) Change in
(deg) Angle of psi(i) axis to hinge axis
(deg) Angle of psi(i) axis to hinge axis
(deg) Percentage Progress
THR-212
ASP-213
7.6
7.8
1.6
-13.6
117.6
112.8
112.3
ASP-213
ILE-214
5.0
5.0
3.2
4.5
108.8
110.8
-69.6
ILE-214
GLN-215
5.1
5.1
-9.9
5.7
135.6
135.1
-7.3
GLN-215
SER-216
6.6
6.7
-2.6
-8.5
120.8
125.3
-76.3
SER-216
GLY-217
3.1
3.4
13.9
-4.9
111.6
116.1
-51.1
GLY-217
ILE-218
4.0
3.8
-2.2
-8.7
99.7
95.3
-79.4
ILE-218
GLN-219
7.7
7.6
10.6
-0.4
18.9
18.1
205.8
GLN-219
ASN-220
7.6
7.6
3.3
-5.1
73.2
67.3
19.6
ASN-220
GLY-221
6.7
6.7
7.5
-11.0
127.4
130.0
84.7
GLY-221
ILE-222
8.9
8.9
1.0
5.4
122.5
120.2
-82.0
ILE-222
ASP-223
6.4
6.4
0.9
4.2
146.3
147.2
-96.3

Graph shows rotational transition at bending residues and can be used
to identify hinge bending residues.
Probably only informative for interdomain rotations greater than 20 degrees
Residue
iResidue
i+1Distance of hinge axis to residue i in
(A) Distance of hinge axis to residue i in
(A) Change in
(deg) Change in
(deg) Angle of psi(i) axis to hinge axis
(deg) Angle of psi(i) axis to hinge axis
(deg) Percentage Progress
THR-232
PRO-233
13.7
13.4
-1.3
-10.1
10.5
9.1
256.0
PRO-233
LYS-234
14.8
14.7
4.1
5.0
119.4
120.8
-201.4
LYS-234
SER-235
12.9
13.3
-16.5
7.7
76.3
83.7
15.7
SER-235
ALA-236
16.2
16.6
10.1
-0.7
46.7
43.4
176.8
ALA-236
VAL-237
15.9
16.1
-20.0
2.1
90.2
87.8
-101.5
VAL-237
PRO-238
12.8
13.1
5.3
19.8
88.0
99.8
-146.8

Graph shows rotational transition at bending residues and can be used
to identify hinge bending residues.
Probably only informative for interdomain rotations greater than 20 degrees
Residue
iResidue
i+1Distance of hinge axis to residue i in
(A) Distance of hinge axis to residue i in
(A) Change in
(deg) Change in
(deg) Angle of psi(i) axis to hinge axis
(deg) Angle of psi(i) axis to hinge axis
(deg) Percentage Progress
THR-239
LEU-240
17.8
17.8
34.4
-6.2
146.2
148.5
-452.0
LEU-240
PRO-241
14.8
14.9
12.9
-4.6
114.0
114.0
-18.0
PRO-241
THR-242
15.8
15.8
-12.5
2.7
105.2
110.9
-6.2
THR-242
PRO-243
13.3
13.4
5.5
-0.1
55.1
62.7
78.4
PRO-243
PRO-244
10.9
10.7
11.8
-2.3
107.0
110.0
-51.6

Graph shows rotational transition at bending residues and can be used
to identify hinge bending residues.
Probably only informative for interdomain rotations greater than 20 degrees