Succinyl-Coa:3-Ketoacid-Coenzyme A Transferase 1, Mitochondrial
(All numbering and residues are taken from first PDB file)
![]()
![]()
Bending Residue Dihedral Analysis
Residue
iResidue
i+1Distance of hinge axis to residue i in
(A) Distance of hinge axis to residue i in
(A) Change in
(deg) Change in
(deg) Angle of psi(i) axis to hinge axis
(deg) Angle of psi(i) axis to hinge axis
(deg) Percentage Progress
LEU-243
SER-244
24.9
24.5
-6.8
9.2
62.7
62.9
-15.5
SER-244
VAL-245
22.9
22.3
0.5
7.3
168.1
166.7
-24.2
VAL-245
ARG-246
24.3
23.6
7.8
13.8
126.2
129.8
-58.9
ASN-261
VAL-262
25.6
24.8
-8.2
9.6
110.5
106.8
50.8
VAL-262
ARG-263
23.9
22.7
-0.9
-4.7
90.4
81.6
23.8

Graph shows rotational transition at bending residues and can be used
to identify hinge bending residues.
Probably only informative for interdomain rotations greater than 20 degrees
Residue
iResidue
i+1Distance of hinge axis to residue i in
(A) Distance of hinge axis to residue i in
(A) Change in
(deg) Change in
(deg) Angle of psi(i) axis to hinge axis
(deg) Angle of psi(i) axis to hinge axis
(deg) Percentage Progress
GLU-275
ASP-276
5.1
5.1
-7.4
9.4
117.4
121.7
33.9
ASP-276
GLY-277
2.5
2.8
0.6
3.0
105.4
106.8
-7.3
GLY-277
MET-278
1.2
0.9
-11.8
8.1
12.6
12.5
22.3
MET-278
TYR-279
0.8
0.8
1.5
1.5
122.3
119.0
10.1
TYR-279
ALA-280
2.2
2.2
-5.3
2.3
37.5
36.5
22.3
ALA-280
ASN-281
2.0
1.9
-8.9
19.6
48.8
52.4
-136.6
ASN-281
LEU-282
3.8
3.8
27.0
-6.1
109.9
108.9
-48.2
ASN-281
LEU-282
3.8
3.8
27.0
-6.1
109.9
108.9
-48.2

Graph shows rotational transition at bending residues and can be used
to identify hinge bending residues.
Probably only informative for interdomain rotations greater than 20 degrees
Residue
iResidue
i+1Distance of hinge axis to residue i in
(A) Distance of hinge axis to residue i in
(A) Change in
(deg) Change in
(deg) Angle of psi(i) axis to hinge axis
(deg) Angle of psi(i) axis to hinge axis
(deg) Percentage Progress
ASN-281
LEU-282
3.8
3.8
27.0
-6.1
109.9
108.9
-48.2
ASN-281
LEU-282
3.8
3.8
27.0
-6.1
109.9
108.9
-48.2
LEU-282
GLY-283
6.5
6.8
-15.9
-1.5
35.6
23.8
131.3
GLY-283
ILE-284
8.2
7.3
4.2
-2.3
83.4
102.5
-8.6
ILE-284
GLY-285
11.9
10.5
5.9
6.0
85.8
93.7
-9.9
GLY-285
ILE-286
14.4
13.1
-12.9
2.2
143.2
153.3
-82.8
ILE-286
PRO-287
14.2
14.0
3.5
10.0
50.9
39.0
73.5
PRO-287
LEU-288
10.6
10.8
12.8
9.9
50.1
56.0
63.9
LEU-288
LEU-289
11.4
12.3
7.9
4.7
48.8
36.9
77.6
LEU-289
ALA-290
14.6
14.8
5.8
1.5
42.4
32.3
8.9
ALA-290
SER-291
12.8
12.0
0.8
-0.4
40.4
46.0
-13.7
SER-291
ASN-292
10.9
11.9
13.4
-32.9
44.4
48.1
-68.4
ASN-292
PHE-293
14.3
15.0
31.1
-41.2
42.9
54.9
-36.5
PHE-293
ILE-294
14.1
13.7
31.4
-15.5
55.3
60.9
47.8
ILE-294
SER-295
10.6
10.6
-8.1
-2.3
160.0
158.1
-72.1
SER-295
PRO-296
10.7
11.1
1.9
-12.3
73.3
44.3
33.6
PRO-296
ASN-297
10.5
11.1
18.5
-33.0
60.8
55.4
-18.8
ASN-297
MET-298
7.5
8.4
42.6
-48.3
128.9
123.9
65.5
MET-298
THR-299
5.6
5.9
17.0
-3.2
116.6
113.9
-60.2
THR-299
VAL-300
4.3
4.4
0.9
-0.8
156.7
157.8
-14.0
VAL-300
HIS-301
4.1
4.3
4.3
-6.5
117.0
117.1
8.8
HIS-301
LEU-302
5.5
5.3
-8.3
-2.0
11.0
12.1
51.6
LEU-302
GLN-303
6.6
6.4
-1.6
-0.4
54.6
54.8
21.7

Graph shows rotational transition at bending residues and can be used
to identify hinge bending residues.
Probably only informative for interdomain rotations greater than 20 degrees
Residue
iResidue
i+1Distance of hinge axis to residue i in
(A) Distance of hinge axis to residue i in
(A) Change in
(deg) Change in
(deg) Angle of psi(i) axis to hinge axis
(deg) Angle of psi(i) axis to hinge axis
(deg) Percentage Progress
HIS-354
VAL-355
8.0
8.1
8.6
-15.2
112.2
107.5
27.7
VAL-355
ASN-356
4.2
4.4
5.8
-8.8
96.3
91.6
-7.7
ASN-356
LEU-357
3.9
3.9
7.6
-16.0
58.6
55.9
-20.9
LEU-357
THR-358
2.9
2.7
21.9
-23.5
47.5
56.7
43.7
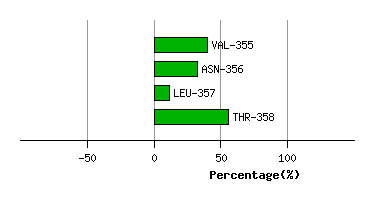
Graph shows rotational transition at bending residues and can be used
to identify hinge bending residues.
Probably only informative for interdomain rotations greater than 20 degrees
Residue
iResidue
i+1Distance of hinge axis to residue i in
(A) Distance of hinge axis to residue i in
(A) Change in
(deg) Change in
(deg) Angle of psi(i) axis to hinge axis
(deg) Angle of psi(i) axis to hinge axis
(deg) Percentage Progress
ILE-376
PRO-377
11.2
11.6
2.7
2.8
156.3
157.7
-43.3
PRO-377
GLY-378
10.2
10.2
-3.2
4.8
63.4
55.5
-21.5
GLY-378
LYS-379
12.8
12.5
-27.3
28.2
130.0
117.2
91.6
LYS-379
LEU-380
14.7
15.1
17.6
-33.4
38.3
32.4
-56.8
LEU-380
VAL-381
12.7
14.3
19.5
19.5
105.1
78.9
-16.9
VAL-381
LYS-382
10.4
11.9
52.1
-13.2
62.5
25.3
194.3
LYS-382
GLY-383
11.5
11.2
-42.3
-8.4
108.3
94.1
-106.5
GLY-383
MET-384
8.2
8.2
-15.2
15.7
143.1
146.0
-20.3
MET-384
GLY-385
5.5
5.3
-0.3
-8.8
152.4
150.2
-42.3

Graph shows rotational transition at bending residues and can be used
to identify hinge bending residues.
Probably only informative for interdomain rotations greater than 20 degrees
Residue
iResidue
i+1Distance of hinge axis to residue i in
(A) Distance of hinge axis to residue i in
(A) Change in
(deg) Change in
(deg) Angle of psi(i) axis to hinge axis
(deg) Angle of psi(i) axis to hinge axis
(deg) Percentage Progress
SER-392
SER-393
6.1
6.1
17.4
-10.7
129.9
135.8
1.8
SER-393
ALA-394
8.0
7.9
-6.9
20.5
72.5
70.3
-37.9
ALA-394
LYS-395
10.4
10.4
2.7
-16.2
175.4
164.4
83.5
LYS-395
THR-396
9.9
9.2
25.6
-28.4
109.7
102.9
23.0
THR-396
LYS-397
6.3
5.7
-8.9
0.4
101.3
105.6
-10.9
LYS-397
VAL-398
6.9
6.6
24.2
-18.1
58.1
60.3
39.9

Graph shows rotational transition at bending residues and can be used
to identify hinge bending residues.
Probably only informative for interdomain rotations greater than 20 degrees