Tata-Binding Protein
(All numbering and residues are taken from first PDB file)
![]()
![]()
Bending Residue Dihedral Analysis
Residue
iResidue
i+1Distance of hinge axis to residue i in
(A) Distance of hinge axis to residue i in
(A) Change in
(deg) Change in
(deg) Angle of psi(i) axis to hinge axis
(deg) Angle of psi(i) axis to hinge axis
(deg) Percentage Progress
THR-66
LEU-67
8.1
8.7
-3.5
-9.2
23.6
29.6
163.3
LEU-67
GLN-68
5.8
6.0
-7.1
-10.5
71.2
66.4
53.5
GLN-68
ASN-69
7.8
8.1
15.2
-5.9
121.5
133.7
-97.7
ASN-69
ILE-70
5.9
6.1
-11.5
1.5
96.0
92.9
-9.3
ASN-69
ILE-70
5.9
6.1
-11.5
1.5
96.0
92.9
-9.3

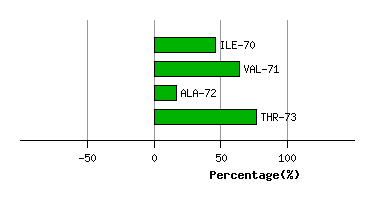
Graph shows rotational transition at bending residues and can be used
to identify hinge bending residues.
Probably only informative for interdomain rotations greater than 20 degrees
Residue
iResidue
i+1Distance of hinge axis to residue i in
(A) Distance of hinge axis to residue i in
(A) Change in
(deg) Change in
(deg) Angle of psi(i) axis to hinge axis
(deg) Angle of psi(i) axis to hinge axis
(deg) Percentage Progress
ASN-69
ILE-70
5.9
6.1
-11.5
1.5
96.0
92.9
-9.3
ASN-69
ILE-70
5.9
6.1
-11.5
1.5
96.0
92.9
-9.3
ILE-70
VAL-71
3.3
3.3
-9.6
8.9
140.1
142.0
17.8
VAL-71
ALA-72
3.8
3.7
-2.0
6.2
83.5
87.1
-46.9
ALA-72
THR-73
6.4
6.1
8.4
1.2
44.8
42.1
60.0
Graph shows rotational transition at bending residues and can be used
to identify hinge bending residues.
Probably only informative for interdomain rotations greater than 20 degrees
Residue
iResidue
i+1Distance of hinge axis to residue i in
(A) Distance of hinge axis to residue i in
(A) Change in
(deg) Change in
(deg) Angle of psi(i) axis to hinge axis
(deg) Angle of psi(i) axis to hinge axis
(deg) Percentage Progress
GLN-158
ASN-159
4.0
3.9
7.7
7.8
84.8
82.0
-0.7
ASN-159
ILE-160
1.7
1.5
-7.0
3.4
142.2
145.2
-49.5
ILE-160
VAL-161
2.3
2.3
-6.6
6.9
82.6
85.3
-13.5

Graph shows rotational transition at bending residues and can be used
to identify hinge bending residues.
Probably only informative for interdomain rotations greater than 20 degrees