Bovine Mitochondrial F1-Atpase
(All numbering and residues are taken from first PDB file)
![]()
![]()
Bending Residue Dihedral Analysis
Residue
iResidue
i+1Distance of hinge axis to residue i in
(A) Distance of hinge axis to residue i in
(A) Change in
(deg) Change in
(deg) Angle of psi(i) axis to hinge axis
(deg) Angle of psi(i) axis to hinge axis
(deg) Percentage Progress
GLN-130
GLU-131
14.5
14.3
28.3
-10.5
87.3
94.0
-33.3
GLU-131
ILE-132
14.3
13.9
55.0
-63.4
79.7
65.1
-40.8
ILE-132
LEU-133
12.3
12.4
-4.2
-9.9
37.0
49.8
112.4
LEU-133
VAL-134
11.3
11.3
-17.6
17.9
117.7
117.8
-30.8

Graph shows rotational transition at bending residues and can be used
to identify hinge bending residues.
Probably only informative for interdomain rotations greater than 20 degrees
Residue
iResidue
i+1Distance of hinge axis to residue i in
(A) Distance of hinge axis to residue i in
(A) Change in
(deg) Change in
(deg) Angle of psi(i) axis to hinge axis
(deg) Angle of psi(i) axis to hinge axis
(deg) Percentage Progress
GLY-149
GLY-150
7.6
7.9
0.4
-22.0
128.2
124.6
79.5
GLY-150
LYS-151
6.0
5.9
-2.2
11.6
97.2
99.6
-17.8
LYS-151
ILE-152
3.0
3.0
-5.1
-1.7
31.3
29.0
34.0
ILE-152
GLY-153
0.1
0.1
-13.6
6.7
85.0
87.0
38.6
GLY-153
LEU-154
3.4
3.6
25.5
-14.4
109.7
114.8
-47.9
LEU-154
PHE-155
5.9
6.1
2.5
-8.0
112.3
112.8
-55.9

Graph shows rotational transition at bending residues and can be used
to identify hinge bending residues.
Probably only informative for interdomain rotations greater than 20 degrees
Residue
iResidue
i+1Distance of hinge axis to residue i in
(A) Distance of hinge axis to residue i in
(A) Change in
(deg) Change in
(deg) Angle of psi(i) axis to hinge axis
(deg) Angle of psi(i) axis to hinge axis
(deg) Percentage Progress
ASN-171
ASN-172
15.2
15.5
10.7
-5.9
110.3
107.8
6.4
ASN-172
VAL-173
15.0
15.6
-24.2
14.6
116.9
123.7
2.2
VAL-173
ALA-174
12.4
13.3
148.4
-126.6
33.4
28.0
176.1
ALA-174
LYS-175
14.4
15.9
121.8
-106.7
104.1
104.6
23.6
LYS-175
ALA-176
17.6
17.6
-62.8
46.7
75.0
103.9
8.1
ALA-176
HIS-177
17.3
17.7
-82.8
70.6
118.5
131.4
-20.6
HIS-177
GLY-178
15.1
14.9
9.3
65.8
9.3
35.6
473.0
GLY-178
GLY-179
15.2
14.5
-87.8
-156.1
106.2
80.9
-277.0
GLY-179
TYR-180
11.4
12.8
-128.9
12.5
96.1
123.9
-395.0
TYR-180
SER-181
9.6
9.8
-26.1
-3.6
57.9
53.5
126.0
SER-181
VAL-182
7.2
7.6
-5.3
-8.1
121.5
127.3
-15.0
VAL-182
PHE-183
5.7
5.5
-24.3
22.6
45.7
46.3
22.9
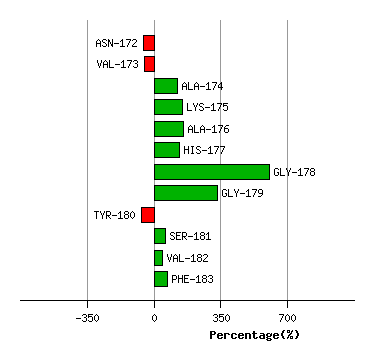
Graph shows rotational transition at bending residues and can be used
to identify hinge bending residues.
Probably only informative for interdomain rotations greater than 20 degrees
Residue
iResidue
i+1Distance of hinge axis to residue i in
(A) Distance of hinge axis to residue i in
(A) Change in
(deg) Change in
(deg) Angle of psi(i) axis to hinge axis
(deg) Angle of psi(i) axis to hinge axis
(deg) Percentage Progress
ALA-331
THR-332
2.3
2.4
16.3
-18.2
97.7
91.6
15.2
THR-332
THR-333
1.3
1.3
14.4
-7.9
78.0
75.8
35.1
THR-333
VAL-334
4.8
4.9
9.5
-18.0
70.5
70.8
-27.1
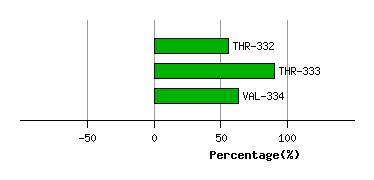
Graph shows rotational transition at bending residues and can be used
to identify hinge bending residues.
Probably only informative for interdomain rotations greater than 20 degrees
Residue
iResidue
i+1Distance of hinge axis to residue i in
(A) Distance of hinge axis to residue i in
(A) Change in
(deg) Change in
(deg) Angle of psi(i) axis to hinge axis
(deg) Angle of psi(i) axis to hinge axis
(deg) Percentage Progress
ASP-352
SER-353
4.1
3.6
33.6
-26.6
27.4
24.0
28.0
SER-353
THR-354
3.6
3.0
-2.8
-1.7
85.0
82.4
34.7
THR-354
SER-355
2.2
2.7
6.6
5.9
34.8
29.9
65.1
SER-355
ARG-356
4.9
5.3
-11.0
13.1
78.2
83.4
-17.1
ARG-356
ILE-357
7.7
7.9
30.8
-77.9
92.5
90.8
-42.0
ILE-357
MET-358
10.2
10.1
54.9
-36.7
138.9
105.7
-22.5
MET-358
ASP-359
10.2
10.3
26.5
-17.5
126.2
143.0
-15.6
ASP-359
PRO-360
13.3
13.4
25.8
7.0
83.6
79.1
-3.3

Graph shows rotational transition at bending residues and can be used
to identify hinge bending residues.
Probably only informative for interdomain rotations greater than 20 degrees