Spike Glycoprotein
(All numbering and residues are taken from first PDB file)
![]()
![]()
Bending Residue Dihedral Analysis
Residue
iResidue
i+1Distance of hinge axis to residue i in
(A) Distance of hinge axis to residue i in
(A) Change in
(deg) Change in
(deg) Angle of psi(i) axis to hinge axis
(deg) Angle of psi(i) axis to hinge axis
(deg) Percentage Progress
LYS-44
MET-45
12.4
12.3
15.1
-12.9
127.2
126.7
-115.5
MET-45
PRO-46
11.9
11.7
-5.6
-1.4
50.7
46.4
59.4
PRO-46
LYS-47
9.1
9.1
-16.6
18.4
32.5
23.5
-165.9
LYS-47
SER-48
9.6
9.3
17.5
-17.8
130.5
124.1
77.2
SER-48
HIS-49
8.2
8.3
-14.3
12.7
67.6
67.0
199.4
HIS-49
LYS-50
4.7
4.7
-4.1
0.4
68.4
69.4
232.6

Graph shows rotational transition at bending residues and can be used
to identify hinge bending residues.
Probably only informative for interdomain rotations greater than 20 degrees
Residue
iResidue
i+1Distance of hinge axis to residue i in
(A) Distance of hinge axis to residue i in
(A) Change in
(deg) Change in
(deg) Angle of psi(i) axis to hinge axis
(deg) Angle of psi(i) axis to hinge axis
(deg) Percentage Progress
TYR-171
LYS-172
10.2
10.1
-10.9
8.6
53.6
58.1
24.0
LYS-172
VAL-173
7.9
7.7
17.0
-18.8
61.9
61.1
-97.6
VAL-173
LYS-174
5.0
4.8
7.9
-12.6
107.8
96.1
41.3
LYS-174
GLY-175
2.8
2.3
11.7
1.5
59.6
57.4
142.3
GLY-175
LEU-176
5.6
5.5
-1.4
7.0
155.9
161.6
86.2
LEU-176
CYS-177
3.9
3.9
-18.0
21.7
90.0
97.6
4.8
CYS-177
ASP-178
1.4
1.7
3.0
-4.7
101.8
91.9
-225.4

Graph shows rotational transition at bending residues and can be used
to identify hinge bending residues.
Probably only informative for interdomain rotations greater than 20 degrees
Residue
iResidue
i+1Distance of hinge axis to residue i in
(A) Distance of hinge axis to residue i in
(A) Change in
(deg) Change in
(deg) Angle of psi(i) axis to hinge axis
(deg) Angle of psi(i) axis to hinge axis
(deg) Percentage Progress
GLU-252
CYS-253
18.7
18.5
2.5
-2.9
149.6
149.3
155.2
CYS-253
PRO-254
19.3
19.2
11.7
-13.3
101.7
95.3
168.7
PRO-254
GLU-255
21.8
21.5
9.1
-1.7
119.7
111.4
98.3
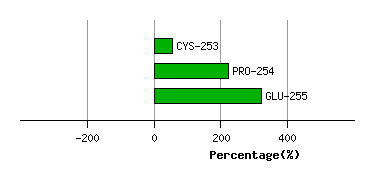
Graph shows rotational transition at bending residues and can be used
to identify hinge bending residues.
Probably only informative for interdomain rotations greater than 20 degrees
Residue
iResidue
i+1Distance of hinge axis to residue i in
(A) Distance of hinge axis to residue i in
(A) Change in
(deg) Change in
(deg) Angle of psi(i) axis to hinge axis
(deg) Angle of psi(i) axis to hinge axis
(deg) Percentage Progress
ILE-259
SER-260
13.3
13.8
7.7
14.5
27.5
25.3
440.6
SER-260
ALA-261
12.9
13.9
-18.5
10.5
79.3
86.4
173.9
ALA-261
PRO-262
11.8
12.1
-26.3
-22.0
135.0
134.6
-738.9

Graph shows rotational transition at bending residues and can be used
to identify hinge bending residues.
Probably only informative for interdomain rotations greater than 20 degrees
Residue
iResidue
i+1Distance of hinge axis to residue i in
(A) Distance of hinge axis to residue i in
(A) Change in
(deg) Change in
(deg) Angle of psi(i) axis to hinge axis
(deg) Angle of psi(i) axis to hinge axis
(deg) Percentage Progress
ALA-402
GLN-403
15.0
15.3
15.8
8.7
86.7
96.1
174.2
GLN-403
VAL-404
12.5
12.2
-20.9
-5.7
150.7
151.1
-539.4
VAL-404
PHE-405
12.7
13.2
-17.0
12.3
93.3
96.3
142.6

Graph shows rotational transition at bending residues and can be used
to identify hinge bending residues.
Probably only informative for interdomain rotations greater than 20 degrees