Inositol 2-Dehydrogenase/d-Chiro-Inositol 3-Dehydrogenase
(All numbering and residues are taken from first PDB file)
![]()
![]()
Bending Residue Dihedral Analysis
Residue
iResidue
i+1Distance of hinge axis to residue i in
(A) Distance of hinge axis to residue i in
(A) Change in
(deg) Change in
(deg) Angle of psi(i) axis to hinge axis
(deg) Angle of psi(i) axis to hinge axis
(deg) Percentage Progress
SER-26
GLY-27
8.2
8.5
-1.0
-4.9
64.7
67.7
-86.1
GLY-27
ALA-28
8.2
8.2
-5.6
13.0
75.4
75.2
-102.1
ALA-28
GLU-29
5.1
5.1
-3.7
8.8
128.7
131.4
86.3
GLU-29
ILE-30
3.0
3.3
-10.5
4.5
64.2
62.6
39.6
ILE-30
VAL-31
4.4
4.2
-6.6
3.0
126.9
126.8
-91.7
VAL-31
ALA-32
7.9
7.7
7.0
-10.4
107.6
105.2
-40.8
ALA-32
VAL-33
10.1
10.0
1.5
-0.6
124.8
126.8
24.3

Graph shows rotational transition at bending residues and can be used
to identify hinge bending residues.
Probably only informative for interdomain rotations greater than 20 degrees
Residue
iResidue
i+1Distance of hinge axis to residue i in
(A) Distance of hinge axis to residue i in
(A) Change in
(deg) Change in
(deg) Angle of psi(i) axis to hinge axis
(deg) Angle of psi(i) axis to hinge axis
(deg) Percentage Progress
ALA-100
THR-101
9.2
9.2
10.4
-3.9
129.6
127.2
-123.3
THR-101
THR-102
11.6
11.4
-11.6
3.4
12.5
7.9
264.0
THR-102
ALA-103
11.1
10.7
7.0
3.8
101.7
99.5
51.3
ALA-103
GLU-104
8.4
8.2
-7.6
2.2
98.4
99.3
-63.9
GLU-104
GLY-105
11.3
11.3
8.9
-9.1
18.6
17.2
-51.5
GLY-105
CYS-106
11.4
11.4
-7.8
8.8
106.4
107.8
15.5
ARG-108
ILE-109
12.6
12.7
3.1
-0.4
140.3
141.7
-76.6
ARG-108
ILE-109
12.6
12.7
3.1
-0.4
140.3
141.7
-76.6

Graph shows rotational transition at bending residues and can be used
to identify hinge bending residues.
Probably only informative for interdomain rotations greater than 20 degrees
Residue
iResidue
i+1Distance of hinge axis to residue i in
(A) Distance of hinge axis to residue i in
(A) Change in
(deg) Change in
(deg) Angle of psi(i) axis to hinge axis
(deg) Angle of psi(i) axis to hinge axis
(deg) Percentage Progress
ARG-108
ILE-109
12.6
12.7
3.1
-0.4
140.3
141.7
-76.6
ARG-108
ILE-109
12.6
12.7
3.1
-0.4
140.3
141.7
-76.6
ILE-109
VAL-110
10.5
10.7
-7.3
7.7
104.6
106.4
94.9
VAL-110
GLU-111
9.6
9.9
4.2
-0.6
82.6
82.1
110.7

Graph shows rotational transition at bending residues and can be used
to identify hinge bending residues.
Probably only informative for interdomain rotations greater than 20 degrees
Residue
iResidue
i+1Distance of hinge axis to residue i in
(A) Distance of hinge axis to residue i in
(A) Change in
(deg) Change in
(deg) Angle of psi(i) axis to hinge axis
(deg) Angle of psi(i) axis to hinge axis
(deg) Percentage Progress
VAL-123
GLY-124
0.1
0.0
-3.8
5.2
114.3
110.9
73.5
GLY-124
PHE-125
3.3
3.3
-0.6
-0.5
57.9
59.3
-24.5
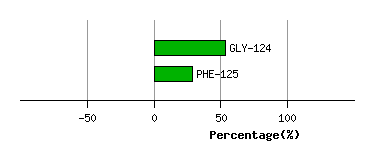
Graph shows rotational transition at bending residues and can be used
to identify hinge bending residues.
Probably only informative for interdomain rotations greater than 20 degrees
Residue
iResidue
i+1Distance of hinge axis to residue i in
(A) Distance of hinge axis to residue i in
(A) Change in
(deg) Change in
(deg) Angle of psi(i) axis to hinge axis
(deg) Angle of psi(i) axis to hinge axis
(deg) Percentage Progress
TYR-280
ASP-281
9.1
9.0
3.2
-3.6
136.1
137.1
-23.5
ASP-281
VAL-282
9.5
9.3
0.4
6.2
69.1
68.6
54.3
VAL-282
GLU-283
10.5
10.3
-8.6
0.6
123.7
120.2
25.1

Graph shows rotational transition at bending residues and can be used
to identify hinge bending residues.
Probably only informative for interdomain rotations greater than 20 degrees
Residue
iResidue
i+1Distance of hinge axis to residue i in
(A) Distance of hinge axis to residue i in
(A) Change in
(deg) Change in
(deg) Angle of psi(i) axis to hinge axis
(deg) Angle of psi(i) axis to hinge axis
(deg) Percentage Progress
GLN-285
ASP-286
7.8
7.9
-6.9
14.1
54.4
52.0
-32.2
ASP-286
PHE-287
9.0
9.0
-2.2
-0.9
80.8
83.3
-31.1
PHE-287
ILE-288
6.2
6.4
-2.3
-2.3
136.6
139.5
57.1

Graph shows rotational transition at bending residues and can be used
to identify hinge bending residues.
Probably only informative for interdomain rotations greater than 20 degrees
Residue
iResidue
i+1Distance of hinge axis to residue i in
(A) Distance of hinge axis to residue i in
(A) Change in
(deg) Change in
(deg) Angle of psi(i) axis to hinge axis
(deg) Angle of psi(i) axis to hinge axis
(deg) Percentage Progress
GLU-296
VAL-297
12.5
12.6
-9.9
9.4
90.2
93.8
-3.3
VAL-297
SER-298
9.1
9.3
3.9
-7.2
43.8
41.5
26.8
SER-298
GLY-299
9.7
9.9
22.5
-19.8
57.1
64.5
5.1
GLY-299
PRO-300
7.0
7.1
-2.8
2.6
157.4
152.3
65.6
PRO-300
THR-301
4.8
4.8
2.7
-8.7
87.3
89.9
43.8
THR-301
ALA-302
4.8
4.6
3.0
3.5
70.1
69.0
-3.7
ALA-302
TRP-303
4.7
4.6
2.5
-5.2
14.2
16.3
-60.0
ALA-302
TRP-303
4.7
4.6
2.5
-5.2
14.2
16.3
-60.0

Graph shows rotational transition at bending residues and can be used
to identify hinge bending residues.
Probably only informative for interdomain rotations greater than 20 degrees
Residue
iResidue
i+1Distance of hinge axis to residue i in
(A) Distance of hinge axis to residue i in
(A) Change in
(deg) Change in
(deg) Angle of psi(i) axis to hinge axis
(deg) Angle of psi(i) axis to hinge axis
(deg) Percentage Progress
ALA-302
TRP-303
4.7
4.6
2.5
-5.2
14.2
16.3
-60.0
ALA-302
TRP-303
4.7
4.6
2.5
-5.2
14.2
16.3
-60.0
TRP-303
ASP-304
4.5
4.3
3.4
-2.9
82.4
84.8
117.8
ASP-304
GLY-305
2.0
2.0
4.0
-4.0
94.9
96.4
-17.9

Graph shows rotational transition at bending residues and can be used
to identify hinge bending residues.
Probably only informative for interdomain rotations greater than 20 degrees
Residue
iResidue
i+1Distance of hinge axis to residue i in
(A) Distance of hinge axis to residue i in
(A) Change in
(deg) Change in
(deg) Angle of psi(i) axis to hinge axis
(deg) Angle of psi(i) axis to hinge axis
(deg) Percentage Progress
ALA-308
ALA-309
4.1
4.3
7.7
-6.4
109.8
108.3
29.1
ALA-309
VAL-310
6.0
6.1
0.6
-1.6
171.0
170.3
68.9
VAL-310
THR-311
5.3
5.4
7.6
-11.6
108.7
106.5
49.2

Graph shows rotational transition at bending residues and can be used
to identify hinge bending residues.
Probably only informative for interdomain rotations greater than 20 degrees
Residue
iResidue
i+1Distance of hinge axis to residue i in
(A) Distance of hinge axis to residue i in
(A) Change in
(deg) Change in
(deg) Angle of psi(i) axis to hinge axis
(deg) Angle of psi(i) axis to hinge axis
(deg) Percentage Progress
GLN-323
LYS-324
15.6
15.6
-6.8
22.0
65.7
59.3
-166.6
LYS-324
GLU-325
12.6
12.5
35.6
-41.0
97.3
96.5
165.2
GLU-325
LYS-326
10.2
10.1
-10.9
18.7
83.8
75.5
46.3
LYS-326
VAL-327
6.4
6.3
-2.3
5.3
27.4
20.4
49.9
VAL-327
GLU-328
4.3
4.4
10.4
-3.7
79.6
76.9
15.7
GLU-328
LEU-329
2.6
2.8
-4.0
-9.3
37.2
38.1
319.3

Graph shows rotational transition at bending residues and can be used
to identify hinge bending residues.
Probably only informative for interdomain rotations greater than 20 degrees