Kinesin
(All numbering and residues are taken from first PDB file)
![]()
![]()
Bending Residue Dihedral Analysis
Residue
iResidue
i+1Distance of hinge axis to residue i in
(A) Distance of hinge axis to residue i in
(A) Change in
(deg) Change in
(deg) Angle of psi(i) axis to hinge axis
(deg) Angle of psi(i) axis to hinge axis
(deg) Percentage Progress
ASN-152
LEU-153
5.8
6.0
5.6
10.3
38.4
37.4
101.4
LEU-153
SER-154
5.5
5.8
-9.4
19.0
146.3
146.9
89.8
SER-154
VAL-155
4.6
5.0
1.3
-11.0
59.7
66.0
-66.9

Graph shows rotational transition at bending residues and can be used
to identify hinge bending residues.
Probably only informative for interdomain rotations greater than 20 degrees
Residue
iResidue
i+1Distance of hinge axis to residue i in
(A) Distance of hinge axis to residue i in
(A) Change in
(deg) Change in
(deg) Angle of psi(i) axis to hinge axis
(deg) Angle of psi(i) axis to hinge axis
(deg) Percentage Progress
VAL-165
LYS-166
6.5
6.4
-3.5
-21.0
94.7
87.7
-2.9
LYS-166
GLY-167
8.7
8.8
17.3
3.8
24.3
32.5
156.1
GLY-167
CYS-168
11.0
11.1
-4.7
-3.7
139.6
151.0
-50.9

Graph shows rotational transition at bending residues and can be used
to identify hinge bending residues.
Probably only informative for interdomain rotations greater than 20 degrees
Residue
iResidue
i+1Distance of hinge axis to residue i in
(A) Distance of hinge axis to residue i in
(A) Change in
(deg) Change in
(deg) Angle of psi(i) axis to hinge axis
(deg) Angle of psi(i) axis to hinge axis
(deg) Percentage Progress
LEU-268
ALA-269
18.7
18.2
-7.8
-0.9
94.1
95.5
-31.1
ALA-269
GLU-270
22.3
21.9
12.4
-16.7
28.7
41.1
-49.4
GLU-270
GLY-271
22.4
22.5
-9.1
9.6
141.0
151.5
4.0
GLY-271
SER-272
21.2
20.4
-3.8
4.8
124.3
118.6
12.5
SER-272
THR-273
18.1
18.2
-1.3
10.2
100.7
106.8
66.0
THR-273
TYR-274
15.3
15.1
1.1
-0.9
117.1
125.5
10.0
TYR-274
VAL-275
12.8
13.1
2.1
-2.0
163.1
167.0
-1.4
VAL-275
PRO-276
12.6
12.6
-8.3
2.9
68.4
61.5
33.8
PRO-276
TYR-277
10.9
11.2
-3.9
0.4
37.4
44.4
3.2

Graph shows rotational transition at bending residues and can be used
to identify hinge bending residues.
Probably only informative for interdomain rotations greater than 20 degrees
Residue
iResidue
i+1Distance of hinge axis to residue i in
(A) Distance of hinge axis to residue i in
(A) Change in
(deg) Change in
(deg) Angle of psi(i) axis to hinge axis
(deg) Angle of psi(i) axis to hinge axis
(deg) Percentage Progress
ASP-288
SER-289
12.1
12.3
-38.7
66.7
122.5
118.9
134.1
SER-289
LEU-290
14.4
14.5
-49.0
62.3
97.8
71.1
-26.6
LEU-290
GLY-291
14.6
14.9
166.0
178.1
157.3
155.9
91.6
GLY-291
GLY-292
16.7
15.4
-174.7
-178.6
51.8
63.0
10.2
GLY-292
ASN-293
17.2
14.9
-40.3
38.9
95.4
97.5
60.7
ASN-293
CYS-294
19.8
17.1
48.8
-49.7
16.2
14.5
-9.6
CYS-294
ARG-295
19.4
18.3
-5.8
-1.6
117.8
107.6
-18.1
ARG-295
THR-296
21.6
21.3
-45.9
42.1
133.1
147.2
-53.1
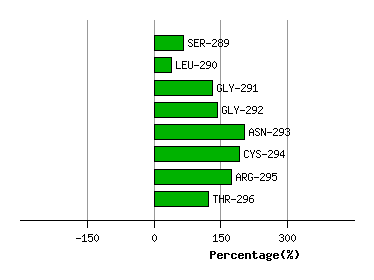
Graph shows rotational transition at bending residues and can be used
to identify hinge bending residues.
Probably only informative for interdomain rotations greater than 20 degrees