Chitinase A
(All numbering and residues are taken from first PDB file)
![]()
![]()
Bending Residue Dihedral Analysis
Residue
iResidue
i+1Distance of hinge axis to residue i in
(A) Distance of hinge axis to residue i in
(A) Change in
(deg) Change in
(deg) Angle of psi(i) axis to hinge axis
(deg) Angle of psi(i) axis to hinge axis
(deg) Percentage Progress
GLN-37
PHE-38
8.3
7.7
2.2
-3.5
161.9
165.1
6.5
PHE-38
SER-39
7.7
7.2
-6.4
6.7
56.2
60.4
23.4
SER-39
LYS-40
6.2
5.9
-2.7
-6.2
22.5
15.3
35.8
LYS-40
ILE-41
4.7
4.5
10.7
-13.9
125.1
121.7
8.2
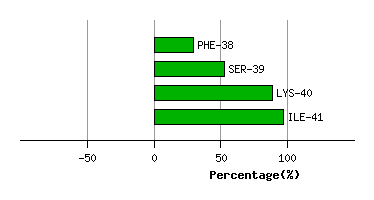
Graph shows rotational transition at bending residues and can be used
to identify hinge bending residues.
Probably only informative for interdomain rotations greater than 20 degrees
Residue
iResidue
i+1Distance of hinge axis to residue i in
(A) Distance of hinge axis to residue i in
(A) Change in
(deg) Change in
(deg) Angle of psi(i) axis to hinge axis
(deg) Angle of psi(i) axis to hinge axis
(deg) Percentage Progress
LYS-56
TYR-57
10.6
10.4
10.6
-19.1
115.2
114.2
22.7
TYR-57
HIS-58
6.9
6.6
11.4
-15.4
74.7
73.4
14.1
HIS-58
GLU-59
6.1
5.2
-7.7
-6.6
84.9
79.4
27.1
GLU-59
LEU-60
4.3
3.0
7.4
0.1
150.1
138.2
-31.6
LEU-60
ALA-61
6.5
5.8
-8.3
-6.7
54.1
55.8
59.4

Graph shows rotational transition at bending residues and can be used
to identify hinge bending residues.
Probably only informative for interdomain rotations greater than 20 degrees
Residue
iResidue
i+1Distance of hinge axis to residue i in
(A) Distance of hinge axis to residue i in
(A) Change in
(deg) Change in
(deg) Angle of psi(i) axis to hinge axis
(deg) Angle of psi(i) axis to hinge axis
(deg) Percentage Progress
THR-130
ILE-131
3.5
3.1
-3.5
-1.4
15.9
15.8
19.6
ILE-131
ALA-132
3.2
2.7
5.2
-9.2
111.3
110.4
7.6
ALA-132
ASP-133
3.6
3.1
-1.4
-2.9
20.7
18.7
16.7
ASP-133
THR-134
3.3
3.2
4.9
-4.7
94.8
91.6
21.5
THR-134
ASP-135
6.6
6.6
6.4
-3.0
84.8
85.4
10.5

Graph shows rotational transition at bending residues and can be used
to identify hinge bending residues.
Probably only informative for interdomain rotations greater than 20 degrees