Major Pepsin Inhibitor Pi-3
(All numbering and residues are taken from first PDB file)
![]()
![]()
Bending Residue Dihedral Analysis
Residue
iResidue
i+1Distance of hinge axis to residue i in
(A) Distance of hinge axis to residue i in
(A) Change in
(deg) Change in
(deg) Angle of psi(i) axis to hinge axis
(deg) Angle of psi(i) axis to hinge axis
(deg) Percentage Progress
THR-14
VAL-15
6.8
6.9
32.9
-17.9
35.7
44.9
135.1
VAL-15
LYS-16
8.0
8.2
18.2
-11.9
87.4
89.6
-7.8
LYS-16
ASP-17
11.4
11.5
-2.9
-0.6
140.5
136.2
-23.8
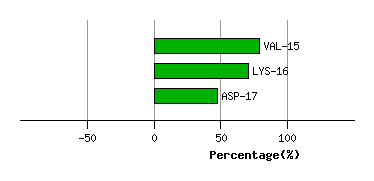
Graph shows rotational transition at bending residues and can be used
to identify hinge bending residues.
Probably only informative for interdomain rotations greater than 20 degrees
Residue
iResidue
i+1Distance of hinge axis to residue i in
(A) Distance of hinge axis to residue i in
(A) Change in
(deg) Change in
(deg) Angle of psi(i) axis to hinge axis
(deg) Angle of psi(i) axis to hinge axis
(deg) Percentage Progress
VAL-20
PHE-21
5.3
5.3
-0.5
5.1
151.6
152.0
29.3
PHE-21
VAL-22
5.5
5.6
2.8
-1.1
57.8
60.2
-4.2
VAL-22
ALA-23
2.7
2.7
-0.4
0.6
150.4
152.4
-0.6

Graph shows rotational transition at bending residues and can be used
to identify hinge bending residues.
Probably only informative for interdomain rotations greater than 20 degrees
Residue
iResidue
i+1Distance of hinge axis to residue i in
(A) Distance of hinge axis to residue i in
(A) Change in
(deg) Change in
(deg) Angle of psi(i) axis to hinge axis
(deg) Angle of psi(i) axis to hinge axis
(deg) Percentage Progress
THR-28
MET-29
6.2
6.0
6.3
-12.7
67.2
66.5
-43.0
MET-29
LEU-30
7.2
6.9
3.5
5.8
43.5
35.3
81.6
LEU-30
GLU-31
5.3
5.2
3.5
-0.6
31.1
31.6
33.5

Graph shows rotational transition at bending residues and can be used
to identify hinge bending residues.
Probably only informative for interdomain rotations greater than 20 degrees
Residue
iResidue
i+1Distance of hinge axis to residue i in
(A) Distance of hinge axis to residue i in
(A) Change in
(deg) Change in
(deg) Angle of psi(i) axis to hinge axis
(deg) Angle of psi(i) axis to hinge axis
(deg) Percentage Progress
PRO-64
PHE-65
5.4
5.4
11.1
-5.0
84.2
81.8
-1.5
PHE-65
CYS-66
1.6
1.7
-2.0
12.2
163.5
160.4
89.4
CYS-66
GLY-67
1.8
1.6
-6.2
9.2
115.9
111.7
17.6

Graph shows rotational transition at bending residues and can be used
to identify hinge bending residues.
Probably only informative for interdomain rotations greater than 20 degrees