L-Asparaginase I
(All numbering and residues are taken from first PDB file)
![]()
![]()
Bending Residue Dihedral Analysis
Residue
iResidue
i+1Distance of hinge axis to residue i in
(A) Distance of hinge axis to residue i in
(A) Change in
(deg) Change in
(deg) Angle of psi(i) axis to hinge axis
(deg) Angle of psi(i) axis to hinge axis
(deg) Percentage Progress
VAL-8
ALA-9
7.3
7.0
2.5
2.1
136.4
136.5
-26.7
ALA-9
TYR-10
5.4
5.1
-3.1
-0.3
117.5
114.9
-58.4
TYR-10
THR-11
8.0
8.0
3.3
-2.7
127.8
125.2
-1.5
THR-11
GLY-12
7.3
7.8
13.0
-37.8
80.2
82.5
-71.3

Graph shows rotational transition at bending residues and can be used
to identify hinge bending residues.
Probably only informative for interdomain rotations greater than 20 degrees
Residue
iResidue
i+1Distance of hinge axis to residue i in
(A) Distance of hinge axis to residue i in
(A) Change in
(deg) Change in
(deg) Angle of psi(i) axis to hinge axis
(deg) Angle of psi(i) axis to hinge axis
(deg) Percentage Progress
MET-46
PRO-47
16.3
16.4
8.0
-7.0
25.4
33.7
-4.6
PRO-47
ASP-48
15.6
15.6
3.0
1.6
45.0
39.9
47.6
ASP-48
PHE-49
16.5
16.2
-6.6
1.3
108.3
108.6
-0.9

Graph shows rotational transition at bending residues and can be used
to identify hinge bending residues.
Probably only informative for interdomain rotations greater than 20 degrees
Residue
iResidue
i+1Distance of hinge axis to residue i in
(A) Distance of hinge axis to residue i in
(A) Change in
(deg) Change in
(deg) Angle of psi(i) axis to hinge axis
(deg) Angle of psi(i) axis to hinge axis
(deg) Percentage Progress
VAL-112
ILE-113
5.0
4.9
7.1
-8.6
43.1
43.1
-12.0
ILE-113
VAL-114
2.3
2.0
5.0
-3.6
110.7
110.3
10.9
VAL-114
THR-115
1.5
1.8
4.1
-0.7
39.2
39.6
31.4

Graph shows rotational transition at bending residues and can be used
to identify hinge bending residues.
Probably only informative for interdomain rotations greater than 20 degrees
Residue
iResidue
i+1Distance of hinge axis to residue i in
(A) Distance of hinge axis to residue i in
(A) Change in
(deg) Change in
(deg) Angle of psi(i) axis to hinge axis
(deg) Angle of psi(i) axis to hinge axis
(deg) Percentage Progress
ILE-130
ASN-131
10.5
10.8
7.3
-1.4
59.9
70.7
-13.8
ASN-131
LEU-132
7.5
7.6
0.6
4.2
42.0
41.3
-0.3
LEU-132
LEU-133
8.8
8.5
-4.8
2.1
68.9
72.2
-13.2
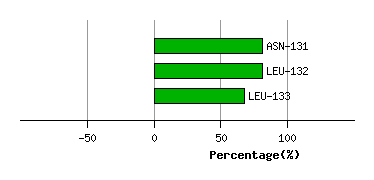
Graph shows rotational transition at bending residues and can be used
to identify hinge bending residues.
Probably only informative for interdomain rotations greater than 20 degrees