Udp-Galactose 4-Epimerase
(All numbering and residues are taken from first PDB file)
![]()
![]()
Bending Residue Dihedral Analysis
Residue
iResidue
i+1Distance of hinge axis to residue i in
(A) Distance of hinge axis to residue i in
(A) Change in
(deg) Change in
(deg) Angle of psi(i) axis to hinge axis
(deg) Angle of psi(i) axis to hinge axis
(deg) Percentage Progress
GLN-140
TYR-141
16.4
17.1
-3.4
84.3
90.2
79.4
-49.9
TYR-141
LEU-142
14.3
14.2
-43.8
17.2
137.7
132.1
-154.1
LEU-142
PRO-143
12.2
12.0
10.0
-6.5
96.5
100.7
-26.2
PRO-143
LEU-144
9.5
9.3
1.0
3.0
134.1
131.8
-22.9

Graph shows rotational transition at bending residues and can be used
to identify hinge bending residues.
Probably only informative for interdomain rotations greater than 20 degrees
Residue
iResidue
i+1Distance of hinge axis to residue i in
(A) Distance of hinge axis to residue i in
(A) Change in
(deg) Change in
(deg) Angle of psi(i) axis to hinge axis
(deg) Angle of psi(i) axis to hinge axis
(deg) Percentage Progress
GLY-198
GLU-199
9.8
9.6
-9.6
9.5
71.0
75.2
-34.3
GLU-199
ASP-200
11.0
10.9
16.7
10.8
38.6
33.1
186.8
ASP-200
PRO-201
13.9
13.7
-11.4
-12.2
67.7
73.9
-4.6

Graph shows rotational transition at bending residues and can be used
to identify hinge bending residues.
Probably only informative for interdomain rotations greater than 20 degrees
Residue
iResidue
i+1Distance of hinge axis to residue i in
(A) Distance of hinge axis to residue i in
(A) Change in
(deg) Change in
(deg) Angle of psi(i) axis to hinge axis
(deg) Angle of psi(i) axis to hinge axis
(deg) Percentage Progress
ARG-239
ASP-240
10.3
10.8
20.0
-18.2
88.7
87.5
-25.9
ASP-240
TYR-241
6.7
7.2
19.4
-44.2
128.7
131.3
153.8
TYR-241
ILE-242
4.7
4.8
1.4
2.5
76.8
80.2
7.0
ILE-242
HIS-243
1.5
2.0
-7.2
1.6
44.1
38.6
54.8

Graph shows rotational transition at bending residues and can be used
to identify hinge bending residues.
Probably only informative for interdomain rotations greater than 20 degrees
Residue
iResidue
i+1Distance of hinge axis to residue i in
(A) Distance of hinge axis to residue i in
(A) Change in
(deg) Change in
(deg) Angle of psi(i) axis to hinge axis
(deg) Angle of psi(i) axis to hinge axis
(deg) Percentage Progress
THR-273
GLY-274
7.8
7.8
38.6
-5.3
62.3
53.5
179.9
GLY-274
TYR-275
9.6
9.5
12.8
-6.5
30.1
30.1
30.7
TYR-275
SER-276
10.8
10.6
1.7
1.9
76.9
74.3
-1.8
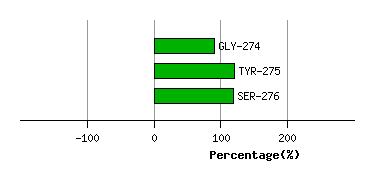
Graph shows rotational transition at bending residues and can be used
to identify hinge bending residues.
Probably only informative for interdomain rotations greater than 20 degrees
Residue
iResidue
i+1Distance of hinge axis to residue i in
(A) Distance of hinge axis to residue i in
(A) Change in
(deg) Change in
(deg) Angle of psi(i) axis to hinge axis
(deg) Angle of psi(i) axis to hinge axis
(deg) Percentage Progress
TYR-308
ALA-309
8.4
8.6
8.9
-1.3
31.5
31.6
63.5
ALA-309
ASN-310
5.5
5.7
-9.8
16.9
116.6
107.0
153.0
ASN-310
PRO-311
4.4
4.2
12.5
-9.2
91.2
91.1
-14.7

Graph shows rotational transition at bending residues and can be used
to identify hinge bending residues.
Probably only informative for interdomain rotations greater than 20 degrees
Residue
iResidue
i+1Distance of hinge axis to residue i in
(A) Distance of hinge axis to residue i in
(A) Change in
(deg) Change in
(deg) Angle of psi(i) axis to hinge axis
(deg) Angle of psi(i) axis to hinge axis
(deg) Percentage Progress
THR-321
ALA-322
6.5
6.7
14.6
14.0
11.4
8.0
245.4
ALA-322
ALA-323
4.8
5.5
41.9
-55.2
63.7
60.8
-191.6
ALA-323
LEU-324
7.5
8.0
48.2
-33.3
40.7
23.8
135.8
LEU-324
GLY-325
5.8
5.8
11.4
1.0
93.5
94.3
-30.8
GLY-325
LEU-326
5.6
5.7
-10.6
-8.9
138.0
118.2
-105.0
LEU-326
ASP-327
5.2
5.0
8.6
-8.8
19.5
8.7
10.0
ASP-327
ARG-328
6.3
5.9
7.2
-0.3
74.5
73.9
38.2
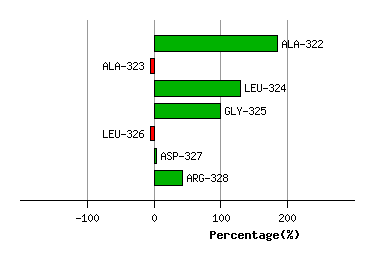
Graph shows rotational transition at bending residues and can be used
to identify hinge bending residues.
Probably only informative for interdomain rotations greater than 20 degrees