Glutaminyl-Trna Synthetase
(All numbering and residues are taken from first PDB file)
![]()
![]()
Bending Residue Dihedral Analysis
Residue
iResidue
i+1Distance of hinge axis to residue i in
(A) Distance of hinge axis to residue i in
(A) Change in
(deg) Change in
(deg) Angle of psi(i) axis to hinge axis
(deg) Angle of psi(i) axis to hinge axis
(deg) Percentage Progress
PHE-31
PRO-32
11.1
11.6
-6.7
-4.7
70.9
75.9
-53.9
PRO-32
PRO-33
11.7
11.7
-18.6
-11.2
64.8
53.4
132.2
PRO-33
GLU-34
15.5
15.3
-73.6
72.8
54.4
81.4
59.5
GLU-34
PRO-35
17.8
17.1
18.6
-7.2
64.7
70.5
93.7
PRO-35
ASN-36
20.5
20.4
32.7
-2.9
133.1
133.4
-235.9
ASN-36
GLY-37
22.5
22.5
15.8
-19.2
91.6
92.9
-0.1
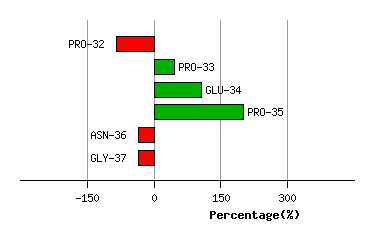
Graph shows rotational transition at bending residues and can be used
to identify hinge bending residues.
Probably only informative for interdomain rotations greater than 20 degrees
Residue
iResidue
i+1Distance of hinge axis to residue i in
(A) Distance of hinge axis to residue i in
(A) Change in
(deg) Change in
(deg) Angle of psi(i) axis to hinge axis
(deg) Angle of psi(i) axis to hinge axis
(deg) Percentage Progress
ARG-64
PHE-65
11.6
11.7
15.9
-7.4
131.4
131.9
-42.3
PHE-65
ASP-66
15.0
14.8
-43.6
35.1
53.1
43.7
32.5
ASP-66
ASP-67
15.4
13.9
-23.8
6.7
82.5
67.6
137.0
ASP-67
THR-68
18.7
17.1
42.8
-42.1
123.8
123.6
38.2
THR-68
ASN-69
18.0
16.8
28.7
-54.0
56.9
46.9
-144.9
THR-68
ASN-69
18.0
16.8
28.7
-54.0
56.9
46.9
-144.9

Graph shows rotational transition at bending residues and can be used
to identify hinge bending residues.
Probably only informative for interdomain rotations greater than 20 degrees
Residue
iResidue
i+1Distance of hinge axis to residue i in
(A) Distance of hinge axis to residue i in
(A) Change in
(deg) Change in
(deg) Angle of psi(i) axis to hinge axis
(deg) Angle of psi(i) axis to hinge axis
(deg) Percentage Progress
THR-68
ASN-69
18.0
16.8
28.7
-54.0
56.9
46.9
-144.9
THR-68
ASN-69
18.0
16.8
28.7
-54.0
56.9
46.9
-144.9
ASN-69
PRO-70
20.9
19.7
-13.7
18.7
62.0
59.7
21.5
LYS-72
GLU-73
27.3
23.8
-68.3
-30.7
63.0
22.1
897.5
GLU-73
ASP-74
24.8
23.3
-168.4
158.2
74.5
55.2
-118.3
ASP-74
ILE-75
27.5
25.7
86.0
-14.0
141.1
157.6
-719.0
ILE-75
GLU-76
26.2
25.5
-129.2
115.8
75.8
72.5
183.9
GLU-76
TYR-77
26.6
27.3
15.9
-16.9
71.9
79.5
27.2
TYR-77
VAL-78
24.1
24.4
11.9
-6.0
54.9
51.8
0.6
TYR-77
VAL-78
24.1
24.4
11.9
-6.0
54.9
51.8
0.6

Graph shows rotational transition at bending residues and can be used
to identify hinge bending residues.
Probably only informative for interdomain rotations greater than 20 degrees
Residue
iResidue
i+1Distance of hinge axis to residue i in
(A) Distance of hinge axis to residue i in
(A) Change in
(deg) Change in
(deg) Angle of psi(i) axis to hinge axis
(deg) Angle of psi(i) axis to hinge axis
(deg) Percentage Progress
TYR-77
VAL-78
24.1
24.4
11.9
-6.0
54.9
51.8
0.6
TYR-77
VAL-78
24.1
24.4
11.9
-6.0
54.9
51.8
0.6
VAL-78
GLU-79
21.1
21.6
0.2
11.4
32.6
36.0
110.5
GLU-79
SER-80
22.8
23.7
-8.5
-2.7
77.1
82.1
31.3

Graph shows rotational transition at bending residues and can be used
to identify hinge bending residues.
Probably only informative for interdomain rotations greater than 20 degrees
Residue
iResidue
i+1Distance of hinge axis to residue i in
(A) Distance of hinge axis to residue i in
(A) Change in
(deg) Change in
(deg) Angle of psi(i) axis to hinge axis
(deg) Angle of psi(i) axis to hinge axis
(deg) Percentage Progress
ILE-81
LYS-82
21.1
21.2
-2.3
-2.8
37.0
27.7
56.0
LYS-82
ASN-83
19.4
20.0
0.9
3.7
119.8
119.4
-45.1
ASN-83
ASP-84
22.4
23.1
0.0
-3.4
114.9
108.2
4.6

Graph shows rotational transition at bending residues and can be used
to identify hinge bending residues.
Probably only informative for interdomain rotations greater than 20 degrees
Residue
iResidue
i+1Distance of hinge axis to residue i in
(A) Distance of hinge axis to residue i in
(A) Change in
(deg) Change in
(deg) Angle of psi(i) axis to hinge axis
(deg) Angle of psi(i) axis to hinge axis
(deg) Percentage Progress
TYR-98
SER-99
14.2
14.2
11.3
-10.2
128.3
129.7
24.4
SER-99
SER-100
13.4
13.3
1.7
6.4
86.3
84.9
44.7
SER-100
ASP-101
16.8
16.7
-23.5
14.6
136.8
131.8
-79.8
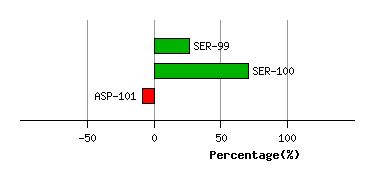
Graph shows rotational transition at bending residues and can be used
to identify hinge bending residues.
Probably only informative for interdomain rotations greater than 20 degrees
Residue
iResidue
i+1Distance of hinge axis to residue i in
(A) Distance of hinge axis to residue i in
(A) Change in
(deg) Change in
(deg) Angle of psi(i) axis to hinge axis
(deg) Angle of psi(i) axis to hinge axis
(deg) Percentage Progress
HIS-215
CYS-216
7.7
7.4
5.3
-7.0
106.7
107.0
40.6
CYS-216
ILE-217
4.8
4.5
-0.6
-3.3
44.7
43.5
32.4
ILE-217
SER-218
7.5
7.2
11.4
-7.2
155.2
150.8
-90.3
SER-218
ASP-219
7.4
7.4
0.9
-7.1
65.8
63.1
-35.3
SER-218
ASP-219
7.4
7.4
0.9
-7.1
65.8
63.1
-35.3

Graph shows rotational transition at bending residues and can be used
to identify hinge bending residues.
Probably only informative for interdomain rotations greater than 20 degrees
Residue
iResidue
i+1Distance of hinge axis to residue i in
(A) Distance of hinge axis to residue i in
(A) Change in
(deg) Change in
(deg) Angle of psi(i) axis to hinge axis
(deg) Angle of psi(i) axis to hinge axis
(deg) Percentage Progress
SER-218
ASP-219
7.4
7.4
0.9
-7.1
65.8
63.1
-35.3
SER-218
ASP-219
7.4
7.4
0.9
-7.1
65.8
63.1
-35.3
ASP-219
ALA-220
3.7
3.7
9.5
-11.9
65.8
67.0
-22.8
ALA-220
LEU-221
4.5
4.3
7.4
0.1
25.8
28.6
54.8
LEU-221
GLU-222
6.8
6.7
-13.1
9.3
138.2
140.3
-12.0
GLU-222
GLY-223
4.4
4.4
-2.3
-5.1
107.0
101.2
-0.2
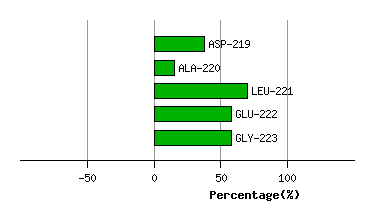
Graph shows rotational transition at bending residues and can be used
to identify hinge bending residues.
Probably only informative for interdomain rotations greater than 20 degrees
Residue
iResidue
i+1Distance of hinge axis to residue i in
(A) Distance of hinge axis to residue i in
(A) Change in
(deg) Change in
(deg) Angle of psi(i) axis to hinge axis
(deg) Angle of psi(i) axis to hinge axis
(deg) Percentage Progress
SER-227
LEU-228
5.0
5.3
8.5
-13.9
132.0
124.3
59.6
LEU-228
CYS-229
8.6
9.0
-9.9
0.8
62.2
63.1
9.4
CYS-229
THR-230
9.7
10.3
19.6
-17.2
128.4
131.4
-36.3
THR-230
LEU-231
12.5
12.8
6.0
-1.9
147.4
149.2
-55.0

Graph shows rotational transition at bending residues and can be used
to identify hinge bending residues.
Probably only informative for interdomain rotations greater than 20 degrees
Residue
iResidue
i+1Distance of hinge axis to residue i in
(A) Distance of hinge axis to residue i in
(A) Change in
(deg) Change in
(deg) Angle of psi(i) axis to hinge axis
(deg) Angle of psi(i) axis to hinge axis
(deg) Percentage Progress
GLN-234
ASP-235
6.7
7.1
-8.1
6.0
56.5
54.8
40.9
ASP-235
ASN-236
4.2
4.8
2.3
-6.3
55.4
56.5
-10.0
ASN-236
ARG-237
3.9
4.1
2.2
2.5
56.0
54.8
78.3

Graph shows rotational transition at bending residues and can be used
to identify hinge bending residues.
Probably only informative for interdomain rotations greater than 20 degrees
Residue
iResidue
i+1Distance of hinge axis to residue i in
(A) Distance of hinge axis to residue i in
(A) Change in
(deg) Change in
(deg) Angle of psi(i) axis to hinge axis
(deg) Angle of psi(i) axis to hinge axis
(deg) Percentage Progress
PRO-250
VAL-251
10.3
10.6
52.4
-30.2
70.2
83.5
16.2
VAL-251
HIS-252
7.3
7.3
4.4
-13.1
26.3
26.3
-82.0
HIS-252
PRO-253
5.9
5.6
-4.2
-1.5
90.7
84.1
6.6

Graph shows rotational transition at bending residues and can be used
to identify hinge bending residues.
Probably only informative for interdomain rotations greater than 20 degrees
Residue
iResidue
i+1Distance of hinge axis to residue i in
(A) Distance of hinge axis to residue i in
(A) Change in
(deg) Change in
(deg) Angle of psi(i) axis to hinge axis
(deg) Angle of psi(i) axis to hinge axis
(deg) Percentage Progress
GLN-255
TYR-256
4.8
5.0
6.4
-4.9
109.9
111.7
-13.8
TYR-256
GLU-257
8.6
8.7
-1.8
-9.7
79.4
77.2
29.7
GLU-257
PHE-258
10.6
10.8
-11.7
-1.3
100.8
90.4
20.7
PHE-258
SER-259
14.2
14.5
-11.4
19.3
48.0
60.4
-39.5
SER-259
ARG-260
16.7
17.1
-2.8
-12.9
111.8
124.8
-100.1

Graph shows rotational transition at bending residues and can be used
to identify hinge bending residues.
Probably only informative for interdomain rotations greater than 20 degrees