Insulin Receptor Tyrosine Kinase Domain
(All numbering and residues are taken from first PDB file)
![]()
![]()
Bending Residue Dihedral Analysis
Residue
iResidue
i+1Distance of hinge axis to residue i in
(A) Distance of hinge axis to residue i in
(A) Change in
(deg) Change in
(deg) Angle of psi(i) axis to hinge axis
(deg) Angle of psi(i) axis to hinge axis
(deg) Percentage Progress
ALA-1028
VAL-1029
7.3
7.1
-12.9
20.8
52.7
47.4
-41.6
VAL-1029
LYS-1030
6.5
6.1
-1.0
-3.3
45.7
56.0
16.9
LYS-1030
THR-1031
3.4
3.0
-36.1
29.5
36.5
35.6
-17.8

Graph shows rotational transition at bending residues and can be used
to identify hinge bending residues.
Probably only informative for interdomain rotations greater than 20 degrees
Residue
iResidue
i+1Distance of hinge axis to residue i in
(A) Distance of hinge axis to residue i in
(A) Change in
(deg) Change in
(deg) Angle of psi(i) axis to hinge axis
(deg) Angle of psi(i) axis to hinge axis
(deg) Percentage Progress
SER-1049
VAL-1050
10.5
10.7
-6.6
-0.1
47.4
29.6
33.8
VAL-1050
MET-1051
10.6
10.5
6.8
-3.9
135.8
130.0
-3.8
MET-1051
LYS-1052
7.2
7.0
-16.9
14.0
51.6
63.6
29.8
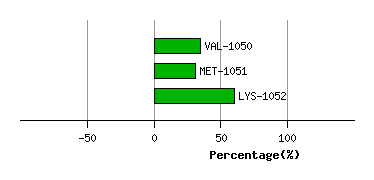
Graph shows rotational transition at bending residues and can be used
to identify hinge bending residues.
Probably only informative for interdomain rotations greater than 20 degrees