Plasmepsin 2
(All numbering and residues are taken from first PDB file)
![]()
![]()
Bending Residue Dihedral Analysis
Residue
iResidue
i+1Distance of hinge axis to residue i in
(A) Distance of hinge axis to residue i in
(A) Change in
(deg) Change in
(deg) Angle of psi(i) axis to hinge axis
(deg) Angle of psi(i) axis to hinge axis
(deg) Percentage Progress
PHE-154
THR-155
7.9
8.0
13.9
-12.0
114.8
114.4
-406.2
THR-155
PHE-156
5.0
5.3
-16.2
3.8
4.8
4.1
338.0
PHE-156
TYR-157
4.0
4.3
0.2
-0.7
110.8
111.5
90.8
TYR-157
LEU-158
3.5
3.7
14.1
-10.1
158.4
163.4
-194.9
LEU-158
PRO-159
2.6
2.8
-2.4
1.5
40.5
45.2
10.0
PRO-159
VAL-160
3.9
4.5
0.0
-1.1
59.2
53.7
89.7
VAL-160
HIS-161
2.4
3.7
7.5
-4.2
160.6
145.3
-283.6
HIS-161
ASP-162
2.1
4.4
169.1
-136.0
114.3
107.8
-138.5
ASP-162
LYS-163
5.2
7.0
-43.2
36.2
127.4
133.4
135.0
LYS-163
HIS-164
7.1
8.7
-13.5
19.5
128.7
124.5
248.7
HIS-164
THR-165
7.7
8.9
-0.2
5.6
108.4
101.7
-6.0

Graph shows rotational transition at bending residues and can be used
to identify hinge bending residues.
Probably only informative for interdomain rotations greater than 20 degrees
Residue
iResidue
i+1Distance of hinge axis to residue i in
(A) Distance of hinge axis to residue i in
(A) Change in
(deg) Change in
(deg) Angle of psi(i) axis to hinge axis
(deg) Angle of psi(i) axis to hinge axis
(deg) Percentage Progress
GLU-185
LYS-186
9.0
9.0
1.0
1.6
70.1
70.7
-55.0
LYS-186
LEU-187
10.3
10.3
-4.3
6.2
55.5
53.9
8.4
LEU-187
ASN-188
12.6
12.6
-9.6
21.5
116.6
117.0
112.0

Graph shows rotational transition at bending residues and can be used
to identify hinge bending residues.
Probably only informative for interdomain rotations greater than 20 degrees
Residue
iResidue
i+1Distance of hinge axis to residue i in
(A) Distance of hinge axis to residue i in
(A) Change in
(deg) Change in
(deg) Angle of psi(i) axis to hinge axis
(deg) Angle of psi(i) axis to hinge axis
(deg) Percentage Progress
TYR-266
THR-267
12.5
12.3
-12.0
12.1
143.0
147.2
20.6
THR-267
LEU-268
14.0
13.7
-0.3
1.5
142.7
141.7
-29.9
LEU-268
GLU-269
12.8
12.6
3.4
-3.7
39.2
40.9
73.5
GLU-269
PRO-270
14.4
14.2
2.1
0.1
31.1
31.3
-5.6
PRO-270
GLU-271
14.4
14.2
-2.2
6.2
112.2
109.1
30.8
PRO-270
GLU-271
14.4
14.2
-2.2
6.2
112.2
109.1
30.8

Graph shows rotational transition at bending residues and can be used
to identify hinge bending residues.
Probably only informative for interdomain rotations greater than 20 degrees
Residue
iResidue
i+1Distance of hinge axis to residue i in
(A) Distance of hinge axis to residue i in
(A) Change in
(deg) Change in
(deg) Angle of psi(i) axis to hinge axis
(deg) Angle of psi(i) axis to hinge axis
(deg) Percentage Progress
PRO-270
GLU-271
14.4
14.2
-2.2
6.2
112.2
109.1
30.8
PRO-270
GLU-271
14.4
14.2
-2.2
6.2
112.2
109.1
30.8
GLU-271
TYR-272
11.7
11.4
-9.3
4.2
67.6
69.9
46.9
TYR-272
TYR-273
9.3
9.1
-8.4
14.0
105.8
105.9
-30.2
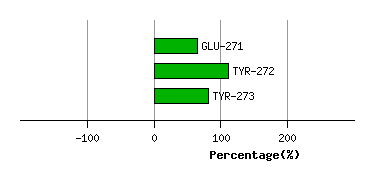
Graph shows rotational transition at bending residues and can be used
to identify hinge bending residues.
Probably only informative for interdomain rotations greater than 20 degrees
Residue
iResidue
i+1Distance of hinge axis to residue i in
(A) Distance of hinge axis to residue i in
(A) Change in
(deg) Change in
(deg) Angle of psi(i) axis to hinge axis
(deg) Angle of psi(i) axis to hinge axis
(deg) Percentage Progress
GLY-283
LEU-284
13.0
13.4
-9.7
-3.6
116.0
123.8
-155.1
LEU-284
CYS-285
12.8
13.2
12.4
-6.7
35.5
39.4
-59.0
CYS-285
MET-286
12.1
12.2
16.2
-19.5
71.2
76.9
-316.2

Graph shows rotational transition at bending residues and can be used
to identify hinge bending residues.
Probably only informative for interdomain rotations greater than 20 degrees
Residue
iResidue
i+1Distance of hinge axis to residue i in
(A) Distance of hinge axis to residue i in
(A) Change in
(deg) Change in
(deg) Angle of psi(i) axis to hinge axis
(deg) Angle of psi(i) axis to hinge axis
(deg) Percentage Progress
HIS-318
SER-319
9.6
9.6
-3.9
3.1
114.8
118.1
47.5
SER-319
VAL-320
7.6
7.5
-8.6
12.5
151.5
151.3
-31.0
VAL-320
GLY-321
6.1
6.1
-0.1
2.2
85.2
83.4
66.2
GLY-321
ILE-322
3.3
3.2
-3.7
1.4
157.9
159.9
-66.0
ILE-322
ALA-323
4.8
4.7
-4.5
5.4
91.4
91.0
-26.9
ALA-323
LEU-324
6.0
5.9
2.1
0.4
12.8
10.6
5.1

Graph shows rotational transition at bending residues and can be used
to identify hinge bending residues.
Probably only informative for interdomain rotations greater than 20 degrees