Histidine-Trna Ligase, Cytoplasmic
(All numbering and residues are taken from first PDB file)
![]()
![]()
Bending Residue Dihedral Analysis
Residue
iResidue
i+1Distance of hinge axis to residue i in
(A) Distance of hinge axis to residue i in
(A) Change in
(deg) Change in
(deg) Angle of psi(i) axis to hinge axis
(deg) Angle of psi(i) axis to hinge axis
(deg) Percentage Progress
MET-70
ALA-71
12.4
12.8
6.2
-11.5
39.4
39.9
-108.6
ALA-71
VAL-72
15.3
15.7
8.0
0.4
33.7
42.4
138.2
VAL-72
ARG-73
15.6
15.9
8.6
-15.0
63.2
63.9
-80.0

Graph shows rotational transition at bending residues and can be used
to identify hinge bending residues.
Probably only informative for interdomain rotations greater than 20 degrees
Residue
iResidue
i+1Distance of hinge axis to residue i in
(A) Distance of hinge axis to residue i in
(A) Change in
(deg) Change in
(deg) Angle of psi(i) axis to hinge axis
(deg) Angle of psi(i) axis to hinge axis
(deg) Percentage Progress
ILE-92
ASP-93
6.7
6.8
8.9
-6.1
24.4
28.0
29.5
ASP-93
THR-94
6.7
6.6
32.4
-56.1
67.6
66.4
-192.8
THR-94
PRO-95
9.4
9.1
-7.5
18.7
164.4
167.3
343.5

Graph shows rotational transition at bending residues and can be used
to identify hinge bending residues.
Probably only informative for interdomain rotations greater than 20 degrees
Residue
iResidue
i+1Distance of hinge axis to residue i in
(A) Distance of hinge axis to residue i in
(A) Change in
(deg) Change in
(deg) Angle of psi(i) axis to hinge axis
(deg) Angle of psi(i) axis to hinge axis
(deg) Percentage Progress
LYS-148
ARG-149
5.9
6.3
8.2
-10.5
146.9
144.5
67.4
ARG-149
TYR-150
4.8
4.9
-4.8
14.1
67.1
65.4
-71.5
TYR-150
HIS-151
3.0
3.0
0.1
6.3
162.2
162.1
-41.2
HIS-151
ILE-152
3.5
3.6
-5.1
7.1
59.6
59.1
-10.1
ILE-152
ALA-153
3.3
3.2
11.6
-10.3
166.2
163.9
-151.5
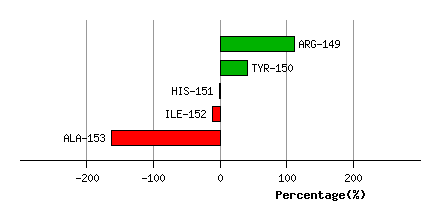
Graph shows rotational transition at bending residues and can be used
to identify hinge bending residues.
Probably only informative for interdomain rotations greater than 20 degrees
Residue
iResidue
i+1Distance of hinge axis to residue i in
(A) Distance of hinge axis to residue i in
(A) Change in
(deg) Change in
(deg) Angle of psi(i) axis to hinge axis
(deg) Angle of psi(i) axis to hinge axis
(deg) Percentage Progress
PHE-171
TYR-172
10.9
10.6
26.1
-27.0
41.0
39.0
-69.5
TYR-172
GLN-173
8.3
8.5
14.4
-2.7
34.4
36.4
322.0
GLN-173
CYS-174
8.7
8.9
-6.7
24.7
129.9
126.3
-52.3
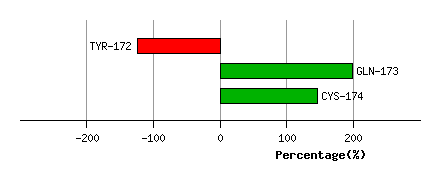
Graph shows rotational transition at bending residues and can be used
to identify hinge bending residues.
Probably only informative for interdomain rotations greater than 20 degrees
Residue
iResidue
i+1Distance of hinge axis to residue i in
(A) Distance of hinge axis to residue i in
(A) Change in
(deg) Change in
(deg) Angle of psi(i) axis to hinge axis
(deg) Angle of psi(i) axis to hinge axis
(deg) Percentage Progress
ASP-177
ILE-178
7.6
7.9
-0.1
-10.2
38.9
44.8
-5.4
ILE-178
ALA-179
8.1
8.3
0.5
4.4
92.5
96.3
89.4
ALA-179
GLY-180
11.3
11.6
-1.5
-4.7
43.1
38.3
178.5
GLY-180
ASN-181
12.8
13.4
-11.3
35.1
43.6
35.2
-185.5

Graph shows rotational transition at bending residues and can be used
to identify hinge bending residues.
Probably only informative for interdomain rotations greater than 20 degrees
Residue
iResidue
i+1Distance of hinge axis to residue i in
(A) Distance of hinge axis to residue i in
(A) Change in
(deg) Change in
(deg) Angle of psi(i) axis to hinge axis
(deg) Angle of psi(i) axis to hinge axis
(deg) Percentage Progress
ARG-362
TYR-363
16.3
16.3
7.9
-3.9
57.4
60.8
71.0
TYR-363
ASP-364
17.9
18.1
9.1
-14.0
100.7
102.2
-62.8
ASP-364
GLY-365
18.9
19.3
23.1
-40.4
53.9
60.8
-159.3

Graph shows rotational transition at bending residues and can be used
to identify hinge bending residues.
Probably only informative for interdomain rotations greater than 20 degrees
Residue
iResidue
i+1Distance of hinge axis to residue i in
(A) Distance of hinge axis to residue i in
(A) Change in
(deg) Change in
(deg) Angle of psi(i) axis to hinge axis
(deg) Angle of psi(i) axis to hinge axis
(deg) Percentage Progress
MET-369
PHE-370
23.1
24.2
-3.5
8.7
41.8
44.0
-38.0
PHE-370
ASP-371
22.3
22.7
-38.8
14.0
110.3
109.4
-10.4
ASP-371
PRO-372
23.4
24.0
-19.2
2.4
83.1
84.5
114.5

Graph shows rotational transition at bending residues and can be used
to identify hinge bending residues.
Probably only informative for interdomain rotations greater than 20 degrees
Residue
iResidue
i+1Distance of hinge axis to residue i in
(A) Distance of hinge axis to residue i in
(A) Change in
(deg) Change in
(deg) Angle of psi(i) axis to hinge axis
(deg) Angle of psi(i) axis to hinge axis
(deg) Percentage Progress
ILE-384
GLY-385
11.6
11.4
1.9
-12.5
17.7
18.6
-168.6
GLY-385
VAL-386
13.9
13.8
5.8
-10.8
66.7
67.8
18.1
VAL-386
GLU-387
12.1
12.3
25.2
-25.3
35.1
34.3
96.4
GLU-387
ARG-388
13.9
14.3
16.1
-1.5
101.7
98.6
-57.5
ARG-388
ILE-389
17.4
17.7
4.3
-10.0
114.3
111.4
70.3
ILE-389
PHE-390
16.4
16.7
4.3
-4.4
47.3
49.2
-42.4
PHE-390
SER-391
15.7
15.9
4.2
0.0
68.9
68.1
26.9

Graph shows rotational transition at bending residues and can be used
to identify hinge bending residues.
Probably only informative for interdomain rotations greater than 20 degrees