Kdo-8-Phosphate Synthetase
(All numbering and residues are taken from first PDB file)
![]()
![]()
Bending Residue Dihedral Analysis
Residue
iResidue
i+1Distance of hinge axis to residue i in
(A) Distance of hinge axis to residue i in
(A) Change in
(deg) Change in
(deg) Angle of psi(i) axis to hinge axis
(deg) Angle of psi(i) axis to hinge axis
(deg) Percentage Progress
GLY-1009
PRO-1010
2.0
2.1
0.8
0.2
55.1
55.4
61.5
PRO-1010
CYS-1011
4.5
4.5
-1.5
-1.1
117.2
116.8
-72.0
CYS-1011
ALA-1012
5.6
5.6
4.2
-3.1
30.7
29.6
75.2

Graph shows rotational transition at bending residues and can be used
to identify hinge bending residues.
Probably only informative for interdomain rotations greater than 20 degrees
Residue
iResidue
i+1Distance of hinge axis to residue i in
(A) Distance of hinge axis to residue i in
(A) Change in
(deg) Change in
(deg) Angle of psi(i) axis to hinge axis
(deg) Angle of psi(i) axis to hinge axis
(deg) Percentage Progress
LEU-1018
LEU-1019
8.8
8.9
1.4
0.2
49.7
49.3
77.8
LEU-1019
LEU-1020
6.6
6.6
-2.3
2.1
127.1
126.9
-14.2
LEU-1020
LYS-1021
9.9
10.0
1.2
-0.7
44.2
44.3
14.1

Graph shows rotational transition at bending residues and can be used
to identify hinge bending residues.
Probably only informative for interdomain rotations greater than 20 degrees
Residue
iResidue
i+1Distance of hinge axis to residue i in
(A) Distance of hinge axis to residue i in
(A) Change in
(deg) Change in
(deg) Angle of psi(i) axis to hinge axis
(deg) Angle of psi(i) axis to hinge axis
(deg) Percentage Progress
VAL-1039
PHE-1040
5.6
5.6
1.7
-2.7
52.5
52.8
-85.9
PHE-1040
LYS-1041
3.7
3.8
0.3
-3.3
45.9
45.7
-102.2
LYS-1041
SER-1042
2.4
2.4
-1.9
4.2
136.4
134.8
66.8
SER-1042
SER-1043
1.4
1.4
1.5
0.3
39.9
40.9
64.1
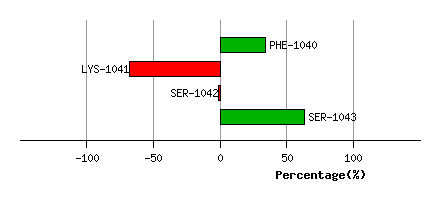
Graph shows rotational transition at bending residues and can be used
to identify hinge bending residues.
Probably only informative for interdomain rotations greater than 20 degrees
Residue
iResidue
i+1Distance of hinge axis to residue i in
(A) Distance of hinge axis to residue i in
(A) Change in
(deg) Change in
(deg) Angle of psi(i) axis to hinge axis
(deg) Angle of psi(i) axis to hinge axis
(deg) Percentage Progress
TYR-1181
ASP-1182
11.4
11.4
1.6
0.1
49.3
49.7
54.4
ASP-1182
ALA-1183
10.7
10.7
6.4
-6.4
106.4
108.6
-9.8
ALA-1183
THR-1184
10.7
10.7
4.2
0.1
47.1
47.8
232.9
THR-1184
GLY-1185
11.3
11.4
-2.5
-11.8
128.1
127.1
-308.9
GLY-1185
SER-1186
13.1
13.4
13.9
-6.0
115.8
117.8
-206.8
SER-1186
VAL-1187
15.7
15.9
6.1
-8.6
92.3
97.9
116.9
VAL-1187
GLN-1188
17.1
17.5
-14.3
7.4
156.2
150.5
-244.7
GLN-1188
LEU-1189
17.5
17.8
-14.1
23.7
102.0
108.6
169.1
LEU-1189
PRO-1190
20.9
21.2
10.6
3.0
18.2
21.0
700.5

Graph shows rotational transition at bending residues and can be used
to identify hinge bending residues.
Probably only informative for interdomain rotations greater than 20 degrees
Residue
iResidue
i+1Distance of hinge axis to residue i in
(A) Distance of hinge axis to residue i in
(A) Change in
(deg) Change in
(deg) Angle of psi(i) axis to hinge axis
(deg) Angle of psi(i) axis to hinge axis
(deg) Percentage Progress
VAL-1219
PHE-1220
6.8
6.8
-2.2
3.8
156.0
155.6
42.8
PHE-1220
MET-1221
6.4
6.4
-1.9
2.3
99.8
98.5
0.2
MET-1221
GLU-1222
5.9
5.8
2.6
1.1
32.4
33.0
170.4
GLU-1222
THR-1223
6.1
6.1
3.2
-4.2
104.6
106.1
-53.8
THR-1223
HIS-1224
6.9
6.9
-4.1
3.9
140.5
141.7
-2.3

Graph shows rotational transition at bending residues and can be used
to identify hinge bending residues.
Probably only informative for interdomain rotations greater than 20 degrees
Residue
iResidue
i+1Distance of hinge axis to residue i in
(A) Distance of hinge axis to residue i in
(A) Change in
(deg) Change in
(deg) Angle of psi(i) axis to hinge axis
(deg) Angle of psi(i) axis to hinge axis
(deg) Percentage Progress
GLY-1245
ILE-1246
9.2
9.1
0.0
0.1
95.5
94.3
21.0
ILE-1246
ILE-1247
7.6
7.6
1.8
0.0
69.8
70.3
72.2
ILE-1247
GLU-1248
3.9
3.9
-0.3
-0.3
168.2
169.8
-33.0

Graph shows rotational transition at bending residues and can be used
to identify hinge bending residues.
Probably only informative for interdomain rotations greater than 20 degrees