Glutamate Receptor Subunit 2
(All numbering and residues are taken from first PDB file)
![]()
![]()
Bending Residue Dihedral Analysis
Residue
iResidue
i+1Distance of hinge axis to residue i in
(A) Distance of hinge axis to residue i in
(A) Change in
(deg) Change in
(deg) Angle of psi(i) axis to hinge axis
(deg) Angle of psi(i) axis to hinge axis
(deg) Percentage Progress
ALA-40
ALA-41
5.4
5.3
-9.3
11.0
73.9
74.6
-56.2
ALA-41
GLU-42
7.0
7.0
0.4
-0.6
50.1
47.7
41.4
GLU-42
ILE-43
7.4
7.2
-4.1
6.1
141.7
143.3
182.4

Graph shows rotational transition at bending residues and can be used
to identify hinge bending residues.
Probably only informative for interdomain rotations greater than 20 degrees
Residue
iResidue
i+1Distance of hinge axis to residue i in
(A) Distance of hinge axis to residue i in
(A) Change in
(deg) Change in
(deg) Angle of psi(i) axis to hinge axis
(deg) Angle of psi(i) axis to hinge axis
(deg) Percentage Progress
CYS-47
GLY-48
13.2
13.1
7.2
-15.7
67.5
63.3
-178.7
GLY-48
PHE-49
16.0
15.8
21.2
-16.5
71.3
76.2
22.6
PHE-49
LYS-50
15.6
15.6
12.0
-9.4
23.5
26.4
188.3
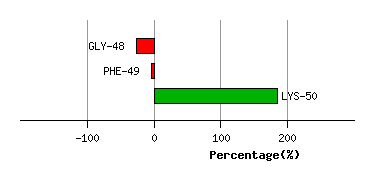
Graph shows rotational transition at bending residues and can be used
to identify hinge bending residues.
Probably only informative for interdomain rotations greater than 20 degrees
Residue
iResidue
i+1Distance of hinge axis to residue i in
(A) Distance of hinge axis to residue i in
(A) Change in
(deg) Change in
(deg) Angle of psi(i) axis to hinge axis
(deg) Angle of psi(i) axis to hinge axis
(deg) Percentage Progress
PHE-106
MET-107
2.5
2.6
13.7
-7.3
111.8
113.4
-78.5
MET-107
SER-108
6.0
6.2
1.1
-4.8
45.5
44.5
-44.1
SER-108
LEU-109
9.0
9.2
-6.8
5.8
62.7
63.5
42.7

Graph shows rotational transition at bending residues and can be used
to identify hinge bending residues.
Probably only informative for interdomain rotations greater than 20 degrees
Residue
iResidue
i+1Distance of hinge axis to residue i in
(A) Distance of hinge axis to residue i in
(A) Change in
(deg) Change in
(deg) Angle of psi(i) axis to hinge axis
(deg) Angle of psi(i) axis to hinge axis
(deg) Percentage Progress
SER-217
LYS-218
13.2
13.4
2.3
-4.0
85.3
82.9
77.9
LYS-218
GLY-219
10.9
11.0
-1.7
5.6
122.7
123.3
117.0
GLY-219
TYR-220
7.7
7.8
2.0
0.5
62.1
59.7
-5.5

Graph shows rotational transition at bending residues and can be used
to identify hinge bending residues.
Probably only informative for interdomain rotations greater than 20 degrees
Residue
iResidue
i+1Distance of hinge axis to residue i in
(A) Distance of hinge axis to residue i in
(A) Change in
(deg) Change in
(deg) Angle of psi(i) axis to hinge axis
(deg) Angle of psi(i) axis to hinge axis
(deg) Percentage Progress
PRO-225
LYS-226
15.4
15.4
0.6
-1.5
31.1
29.6
89.1
LYS-226
GLY-227
15.7
15.8
6.8
4.7
94.0
94.4
33.6
GLY-227
SER-228
16.8
17.0
-11.9
0.3
24.0
30.4
327.0
SER-228
SER-229
16.1
16.0
-6.6
-1.9
89.7
96.4
-65.9
SER-229
LEU-230
17.0
16.6
6.7
3.0
113.6
117.3
-203.7
LEU-230
GLY-231
13.7
13.5
2.1
-0.9
52.8
54.2
-39.6
GLY-231
ASN-232
11.3
11.0
8.9
-4.1
73.5
74.6
80.2
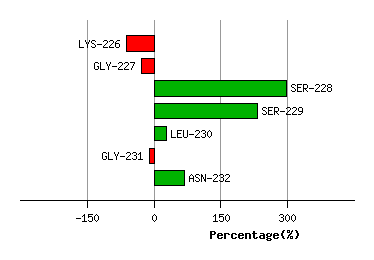
Graph shows rotational transition at bending residues and can be used
to identify hinge bending residues.
Probably only informative for interdomain rotations greater than 20 degrees
Residue
iResidue
i+1Distance of hinge axis to residue i in
(A) Distance of hinge axis to residue i in
(A) Change in
(deg) Change in
(deg) Angle of psi(i) axis to hinge axis
(deg) Angle of psi(i) axis to hinge axis
(deg) Percentage Progress
ASP-248
LYS-249
10.0
10.1
2.8
-3.4
13.0
11.8
-44.6
LYS-249
LEU-250
10.5
10.5
-0.3
2.5
119.8
121.4
94.9
LEU-250
LYS-251
6.9
7.0
3.4
-3.1
91.1
88.3
68.9
LYS-251
ASN-252
8.4
8.6
-4.7
3.6
52.8
53.2
174.3
LYS-251
ASN-252
8.4
8.6
-4.7
3.6
52.8
53.2
174.3
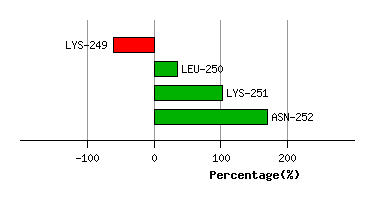
Graph shows rotational transition at bending residues and can be used
to identify hinge bending residues.
Probably only informative for interdomain rotations greater than 20 degrees
Residue
iResidue
i+1Distance of hinge axis to residue i in
(A) Distance of hinge axis to residue i in
(A) Change in
(deg) Change in
(deg) Angle of psi(i) axis to hinge axis
(deg) Angle of psi(i) axis to hinge axis
(deg) Percentage Progress
LYS-251
ASN-252
8.4
8.6
-4.7
3.6
52.8
53.2
174.3
LYS-251
ASN-252
8.4
8.6
-4.7
3.6
52.8
53.2
174.3
ASN-252
LYS-253
11.6
11.7
3.3
-0.6
164.7
163.2
-108.0
LYS-253
TRP-254
9.6
9.7
-3.1
1.2
71.6
70.9
-56.1

Graph shows rotational transition at bending residues and can be used
to identify hinge bending residues.
Probably only informative for interdomain rotations greater than 20 degrees