Putative Enzyme Ydif
(All numbering and residues are taken from first PDB file)
![]()
![]()
Bending Residue Dihedral Analysis
Residue
iResidue
i+1Distance of hinge axis to residue i in
(A) Distance of hinge axis to residue i in
(A) Change in
(deg) Change in
(deg) Angle of psi(i) axis to hinge axis
(deg) Angle of psi(i) axis to hinge axis
(deg) Percentage Progress
THR-274
LEU-275
17.7
17.7
-0.5
-2.2
84.7
86.0
52.5
LEU-275
ASP-276
19.0
19.0
-3.8
20.2
55.5
57.9
-259.8

Graph shows rotational transition at bending residues and can be used
to identify hinge bending residues.
Probably only informative for interdomain rotations greater than 20 degrees
Residue
iResidue
i+1Distance of hinge axis to residue i in
(A) Distance of hinge axis to residue i in
(A) Change in
(deg) Change in
(deg) Angle of psi(i) axis to hinge axis
(deg) Angle of psi(i) axis to hinge axis
(deg) Percentage Progress
GLY-302
ALA-303
3.4
3.5
3.9
-16.0
159.4
159.4
274.0
ALA-303
VAL-304
2.6
2.6
2.3
0.2
95.7
99.7
-52.4
VAL-304
GLY-305
1.4
1.3
-3.2
8.4
29.8
32.1
-172.3
GLY-305
ASN-306
2.4
2.4
9.2
-10.9
108.4
107.6
5.4

Graph shows rotational transition at bending residues and can be used
to identify hinge bending residues.
Probably only informative for interdomain rotations greater than 20 degrees
Residue
iResidue
i+1Distance of hinge axis to residue i in
(A) Distance of hinge axis to residue i in
(A) Change in
(deg) Change in
(deg) Angle of psi(i) axis to hinge axis
(deg) Angle of psi(i) axis to hinge axis
(deg) Percentage Progress
ASP-326
ASP-327
5.8
5.9
-11.5
6.4
79.7
76.6
-113.0
ASP-327
PHE-328
4.4
4.5
2.5
-9.5
145.3
144.6
163.8
PHE-328
ILE-329
2.8
2.8
3.5
-1.6
95.0
99.6
-47.6
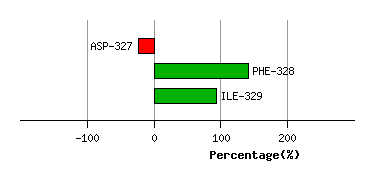
Graph shows rotational transition at bending residues and can be used
to identify hinge bending residues.
Probably only informative for interdomain rotations greater than 20 degrees
Residue
iResidue
i+1Distance of hinge axis to residue i in
(A) Distance of hinge axis to residue i in
(A) Change in
(deg) Change in
(deg) Angle of psi(i) axis to hinge axis
(deg) Angle of psi(i) axis to hinge axis
(deg) Percentage Progress
LEU-371
ASP-372
3.2
3.0
-2.0
-4.3
91.7
92.5
-29.3
ASP-372
VAL-373
3.4
3.2
-2.6
10.8
123.0
120.9
172.4
VAL-373
CYS-374
2.6
2.6
-9.2
7.8
108.0
111.3
-21.5

Graph shows rotational transition at bending residues and can be used
to identify hinge bending residues.
Probably only informative for interdomain rotations greater than 20 degrees
Residue
iResidue
i+1Distance of hinge axis to residue i in
(A) Distance of hinge axis to residue i in
(A) Change in
(deg) Change in
(deg) Angle of psi(i) axis to hinge axis
(deg) Angle of psi(i) axis to hinge axis
(deg) Percentage Progress
GLY-388
VAL-389
7.9
8.2
-7.8
12.6
127.4
127.6
37.6
VAL-389
HIS-390
10.1
10.4
1.9
4.4
107.3
111.5
-37.6
HIS-390
LYS-391
11.2
11.3
6.4
-10.8
137.0
139.6
143.2

Graph shows rotational transition at bending residues and can be used
to identify hinge bending residues.
Probably only informative for interdomain rotations greater than 20 degrees
Residue
iResidue
i+1Distance of hinge axis to residue i in
(A) Distance of hinge axis to residue i in
(A) Change in
(deg) Change in
(deg) Angle of psi(i) axis to hinge axis
(deg) Angle of psi(i) axis to hinge axis
(deg) Percentage Progress
SER-409
LYS-410
3.2
3.2
3.0
-4.7
90.9
89.9
69.7
LYS-410
LYS-411
5.7
5.5
0.3
-4.7
76.2
76.8
-47.4
LYS-411
ILE-412
5.4
5.3
4.7
-5.6
65.4
65.9
74.8

Graph shows rotational transition at bending residues and can be used
to identify hinge bending residues.
Probably only informative for interdomain rotations greater than 20 degrees
Residue
iResidue
i+1Distance of hinge axis to residue i in
(A) Distance of hinge axis to residue i in
(A) Change in
(deg) Change in
(deg) Angle of psi(i) axis to hinge axis
(deg) Angle of psi(i) axis to hinge axis
(deg) Percentage Progress
PHE-452
SER-453
1.6
1.8
-9.2
9.4
54.2
54.6
34.7
SER-453
GLY-454
2.3
2.3
-1.3
4.3
123.2
123.3
49.6
GLY-454
LYS-455
5.8
5.9
-1.6
3.9
85.2
85.9
58.5
LYS-455
ILE-456
7.7
7.5
-7.8
5.3
56.1
55.7
37.6
LYS-455
ILE-456
7.7
7.5
-7.8
5.3
56.1
55.7
37.6

Graph shows rotational transition at bending residues and can be used
to identify hinge bending residues.
Probably only informative for interdomain rotations greater than 20 degrees
Residue
iResidue
i+1Distance of hinge axis to residue i in
(A) Distance of hinge axis to residue i in
(A) Change in
(deg) Change in
(deg) Angle of psi(i) axis to hinge axis
(deg) Angle of psi(i) axis to hinge axis
(deg) Percentage Progress
LYS-455
ILE-456
7.7
7.5
-7.8
5.3
56.1
55.7
37.6
LYS-455
ILE-456
7.7
7.5
-7.8
5.3
56.1
55.7
37.6
ILE-456
ALA-457
6.8
6.6
2.4
-6.7
165.9
165.4
102.8
ALA-457
LEU-458
6.3
6.2
6.4
-4.8
101.0
103.0
-16.9

Graph shows rotational transition at bending residues and can be used
to identify hinge bending residues.
Probably only informative for interdomain rotations greater than 20 degrees
Residue
iResidue
i+1Distance of hinge axis to residue i in
(A) Distance of hinge axis to residue i in
(A) Change in
(deg) Change in
(deg) Angle of psi(i) axis to hinge axis
(deg) Angle of psi(i) axis to hinge axis
(deg) Percentage Progress
ARG-460
GLY-461
10.1
10.1
-13.2
6.6
142.5
139.5
-160.9
GLY-461
LEU-462
11.3
11.2
12.7
-15.3
52.2
45.1
-10.9
LEU-462
ASP-463
8.2
8.3
-3.3
11.5
89.9
86.9
40.7
ASP-463
VAL-464
9.0
9.1
9.0
-2.8
103.4
105.6
-19.0

Graph shows rotational transition at bending residues and can be used
to identify hinge bending residues.
Probably only informative for interdomain rotations greater than 20 degrees
Residue
iResidue
i+1Distance of hinge axis to residue i in
(A) Distance of hinge axis to residue i in
(A) Change in
(deg) Change in
(deg) Angle of psi(i) axis to hinge axis
(deg) Angle of psi(i) axis to hinge axis
(deg) Percentage Progress
PHE-517
ILE-518
25.6
25.6
10.5
-9.7
41.9
47.1
-113.4
ILE-518
ASP-519
26.8
27.0
12.3
-1.0
64.5
68.0
9.8
ASP-519
ALA-520
26.8
26.8
-31.0
52.5
172.1
167.6
499.0
ALA-520
ALA-521
25.1
25.5
35.4
-34.0
89.0
85.4
-228.7
GLY-523
PHE-524
19.2
19.6
-13.0
24.5
61.6
66.1
-100.2
PHE-524
VAL-525
16.6
16.8
15.3
-12.3
59.1
51.7
113.1
VAL-525
LEU-526
14.2
14.5
-0.8
-5.3
45.7
49.9
83.2
LEU-526
PRO-527
11.1
11.2
-5.0
10.0
96.3
93.3
-117.5
PRO-527
GLU-528
12.1
11.9
1.3
1.6
67.7
59.0
15.1

Graph shows rotational transition at bending residues and can be used
to identify hinge bending residues.
Probably only informative for interdomain rotations greater than 20 degrees