Phosphomannomutase
(All numbering and residues are taken from first PDB file)
![]()
![]()
Bending Residue Dihedral Analysis
Residue
iResidue
i+1Distance of hinge axis to residue i in
(A) Distance of hinge axis to residue i in
(A) Change in
(deg) Change in
(deg) Angle of psi(i) axis to hinge axis
(deg) Angle of psi(i) axis to hinge axis
(deg) Percentage Progress
PHE-282
ASP-283
5.8
6.4
-14.8
17.1
40.2
44.3
-10.4
ASP-283
VAL-284
6.2
7.3
-15.3
17.1
82.6
85.1
19.2
VAL-284
LYS-285
5.4
6.4
-11.3
14.0
130.6
132.5
-16.7
LYS-285
CYS-286
7.4
8.4
-5.5
5.6
145.5
141.1
28.8
CYS-286
THR-287
4.4
5.3
8.4
-7.0
92.0
90.9
-1.8
THR-287
ARG-288
3.8
4.2
-2.3
11.6
62.7
58.9
-1.5
ARG-288
ARG-289
4.0
3.8
-5.4
-3.8
129.4
128.0
-32.9
ARG-289
LEU-290
4.6
4.0
6.7
-1.0
90.0
90.7
52.4
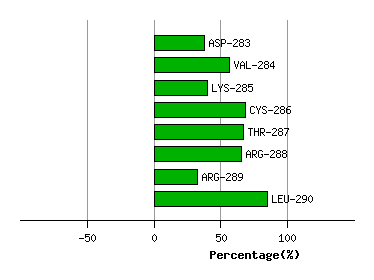
Graph shows rotational transition at bending residues and can be used
to identify hinge bending residues.
Probably only informative for interdomain rotations greater than 20 degrees
Residue
iResidue
i+1Distance of hinge axis to residue i in
(A) Distance of hinge axis to residue i in
(A) Change in
(deg) Change in
(deg) Angle of psi(i) axis to hinge axis
(deg) Angle of psi(i) axis to hinge axis
(deg) Percentage Progress
SER-365
ALA-366
3.6
3.6
13.9
-2.3
109.8
108.7
-41.2
ALA-366
PHE-367
5.3
5.4
-5.4
-6.5
8.3
7.3
100.6
PHE-367
PRO-368
4.6
4.4
-5.5
7.0
70.9
71.3
33.6

Graph shows rotational transition at bending residues and can be used
to identify hinge bending residues.
Probably only informative for interdomain rotations greater than 20 degrees
Residue
iResidue
i+1Distance of hinge axis to residue i in
(A) Distance of hinge axis to residue i in
(A) Change in
(deg) Change in
(deg) Angle of psi(i) axis to hinge axis
(deg) Angle of psi(i) axis to hinge axis
(deg) Percentage Progress
SER-372
THR-373
12.3
12.0
-4.3
16.8
84.8
88.3
3.8
THR-373
PRO-374
15.0
14.9
-5.1
10.8
81.9
73.8
103.6
PRO-374
GLU-375
15.4
15.8
-19.9
18.8
157.1
163.2
-25.7
GLU-375
ILE-376
15.7
15.9
5.7
-0.4
73.7
73.3
-54.1
ILE-376
ASN-377
18.6
18.7
1.0
-11.1
44.8
47.0
-66.5

Graph shows rotational transition at bending residues and can be used
to identify hinge bending residues.
Probably only informative for interdomain rotations greater than 20 degrees
Residue
iResidue
i+1Distance of hinge axis to residue i in
(A) Distance of hinge axis to residue i in
(A) Change in
(deg) Change in
(deg) Angle of psi(i) axis to hinge axis
(deg) Angle of psi(i) axis to hinge axis
(deg) Percentage Progress
GLU-400
GLY-401
14.0
14.4
115.9
-131.8
127.7
138.3
20.5
GLY-401
ASN-402
11.4
11.1
24.1
-5.2
61.5
66.7
67.9
ASN-402
ILE-403
7.9
7.4
-14.7
2.6
91.0
95.9
-12.4
ILE-403
THR-404
6.5
6.5
5.8
-12.3
91.3
82.3
-25.8

Graph shows rotational transition at bending residues and can be used
to identify hinge bending residues.
Probably only informative for interdomain rotations greater than 20 degrees
Residue
iResidue
i+1Distance of hinge axis to residue i in
(A) Distance of hinge axis to residue i in
(A) Change in
(deg) Change in
(deg) Angle of psi(i) axis to hinge axis
(deg) Angle of psi(i) axis to hinge axis
(deg) Percentage Progress
GLY-408
VAL-409
10.8
11.1
8.6
-9.8
101.6
102.8
-12.6
VAL-409
ARG-410
9.7
9.7
8.1
-0.8
29.2
22.4
54.1
ARG-410
VAL-411
7.8
8.0
2.3
3.3
108.4
105.4
-50.5
VAL-411
ASP-412
8.7
8.7
6.8
-4.8
37.8
30.9
39.1

Graph shows rotational transition at bending residues and can be used
to identify hinge bending residues.
Probably only informative for interdomain rotations greater than 20 degrees
Residue
iResidue
i+1Distance of hinge axis to residue i in
(A) Distance of hinge axis to residue i in
(A) Change in
(deg) Change in
(deg) Angle of psi(i) axis to hinge axis
(deg) Angle of psi(i) axis to hinge axis
(deg) Percentage Progress
GLY-416
TRP-417
11.6
11.4
5.5
4.2
38.9
37.4
63.1
TRP-417
GLY-418
10.1
9.9
-9.8
7.5
83.3
91.3
-0.1
GLY-418
LEU-419
11.2
11.3
2.0
-8.2
53.1
53.7
-29.6
LEU-419
VAL-420
10.8
11.1
1.9
4.7
76.4
77.9
-43.5

Graph shows rotational transition at bending residues and can be used
to identify hinge bending residues.
Probably only informative for interdomain rotations greater than 20 degrees