Dna-Directed RNA Polymerase II Largest Subunit
(All numbering and residues are taken from first PDB file)
![]()
![]()
Bending Residue Dihedral Analysis
Residue
iResidue
i+1Distance of hinge axis to residue i in
(A) Distance of hinge axis to residue i in
(A) Change in
(deg) Change in
(deg) Angle of psi(i) axis to hinge axis
(deg) Angle of psi(i) axis to hinge axis
(deg) Percentage Progress
ARG-344
VAL-345
17.3
17.3
29.5
-14.9
48.5
59.1
7.5
VAL-345
ASP-346
15.8
14.6
49.3
23.9
32.0
22.4
176.6
ASP-346
PHE-347
14.5
15.0
27.1
-6.4
48.5
51.4
54.1
PHE-347
SER-348
13.0
13.4
12.0
2.2
89.5
97.2
6.0
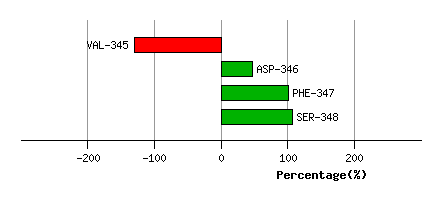
Graph shows rotational transition at bending residues and can be used
to identify hinge bending residues.
Probably only informative for interdomain rotations greater than 20 degrees
Residue
iResidue
i+1Distance of hinge axis to residue i in
(A) Distance of hinge axis to residue i in
(A) Change in
(deg) Change in
(deg) Angle of psi(i) axis to hinge axis
(deg) Angle of psi(i) axis to hinge axis
(deg) Percentage Progress
LEU-1381
THR-1382
25.2
24.4
-17.5
10.2
88.2
82.3
-1.6
THR-1382
SER-1383
22.3
21.4
-12.5
18.1
37.6
37.7
-11.1
SER-1383
VAL-1384
23.4
22.7
3.0
26.1
125.7
137.1
-38.7
VAL-1384
THR-1385
21.5
21.5
29.0
-17.4
107.6
80.2
12.4
THR-1385
ARG-1386
23.4
21.8
98.3
-99.0
47.3
69.1
31.8
ARG-1386
HIS-1387
20.7
19.1
-144.0
39.0
167.8
154.0
-299.2
HIS-1387
GLY-1388
20.3
19.7
55.4
-33.8
66.2
90.5
14.1
GLY-1388
PHE-1389
17.4
18.6
130.8
11.1
123.4
112.5
418.0
PHE-1389
ASN-1390
18.0
15.9
3.2
53.7
109.2
90.4
15.7
ASN-1390
ARG-1391
14.2
13.9
-121.2
177.4
85.2
148.8
31.6
ARG-1391
SER-1392
12.3
13.1
130.8
-150.4
108.6
97.7
-73.2
SER-1392
ASN-1393
13.5
12.3
-2.2
-45.5
73.0
106.4
-37.3
ASN-1393
THR-1394
10.3
8.7
-70.2
65.9
50.1
42.8
14.2
THR-1394
GLY-1395
8.0
7.2
-28.0
70.8
119.3
96.6
35.9
GLY-1395
ALA-1396
5.4
4.5
-23.9
32.7
102.7
91.3
11.5

Graph shows rotational transition at bending residues and can be used
to identify hinge bending residues.
Probably only informative for interdomain rotations greater than 20 degrees
Residue
iResidue
i+1Distance of hinge axis to residue i in
(A) Distance of hinge axis to residue i in
(A) Change in
(deg) Change in
(deg) Angle of psi(i) axis to hinge axis
(deg) Angle of psi(i) axis to hinge axis
(deg) Percentage Progress
GLN-1432
MET-1433
4.7
4.0
-5.5
31.5
104.0
106.4
31.0
MET-1433
ALA-1434
1.8
1.3
18.4
-56.2
150.0
148.4
86.7
ALA-1434
PRO-1435
2.1
2.3
17.2
0.3
79.9
82.2
9.0
PRO-1435
ILE-1436
5.8
6.0
-0.7
24.0
102.9
120.7
32.9
ILE-1436
GLY-1437
7.3
7.1
29.6
-68.7
20.5
50.6
-91.7
GLY-1437
THR-1438
9.4
9.2
61.4
-25.6
70.1
74.3
28.1
THR-1438
GLY-1439
7.4
6.7
10.9
-15.8
127.0
136.9
4.0
GLY-1439
ALA-1440
6.2
6.2
27.4
-19.6
144.9
140.6
-29.3
ALA-1440
PHE-1441
9.1
9.4
-79.9
81.8
92.3
92.4
18.8
PHE-1441
ASP-1442
11.3
11.7
-2.1
-2.6
117.1
105.2
-5.3

Graph shows rotational transition at bending residues and can be used
to identify hinge bending residues.
Probably only informative for interdomain rotations greater than 20 degrees