Hexokinase B
(All numbering and residues are taken from first PDB file)
![]()
![]()
Bending Residue Dihedral Analysis
Residue
iResidue
i+1Distance of hinge axis to residue i in
(A) Distance of hinge axis to residue i in
(A) Change in
(deg) Change in
(deg) Angle of psi(i) axis to hinge axis
(deg) Angle of psi(i) axis to hinge axis
(deg) Percentage Progress
ALA-59
GLN-60
12.0
11.1
2.5
16.4
96.8
98.9
-31.9
GLN-60
ALA-61
9.6
9.0
18.1
-23.2
26.8
34.2
-12.9
ALA-61
GLY-62
9.5
8.6
-10.4
32.1
85.5
81.7
21.3

Graph shows rotational transition at bending residues and can be used
to identify hinge bending residues.
Probably only informative for interdomain rotations greater than 20 degrees
Residue
iResidue
i+1Distance of hinge axis to residue i in
(A) Distance of hinge axis to residue i in
(A) Change in
(deg) Change in
(deg) Angle of psi(i) axis to hinge axis
(deg) Angle of psi(i) axis to hinge axis
(deg) Percentage Progress
LEU-78
ILE-79
7.4
7.2
41.7
-38.1
99.2
102.1
8.9
ILE-79
SER-80
4.1
4.5
27.4
-38.7
89.1
79.6
40.4
SER-80
LEU-81
4.8
5.3
-7.2
29.6
111.0
97.8
10.6
LEU-81
ALA-82
5.5
5.4
20.7
-15.0
110.6
123.6
21.9

Graph shows rotational transition at bending residues and can be used
to identify hinge bending residues.
Probably only informative for interdomain rotations greater than 20 degrees
Residue
iResidue
i+1Distance of hinge axis to residue i in
(A) Distance of hinge axis to residue i in
(A) Change in
(deg) Change in
(deg) Angle of psi(i) axis to hinge axis
(deg) Angle of psi(i) axis to hinge axis
(deg) Percentage Progress
ARG-84
GLN-85
9.7
9.2
15.2
-11.5
52.5
48.8
-24.2
GLN-85
GLU-86
7.0
6.3
-27.2
41.2
82.1
87.8
85.3
GLU-86
SER-87
3.2
2.5
1.7
-21.3
42.9
30.6
-119.1

Graph shows rotational transition at bending residues and can be used
to identify hinge bending residues.
Probably only informative for interdomain rotations greater than 20 degrees
Residue
iResidue
i+1Distance of hinge axis to residue i in
(A) Distance of hinge axis to residue i in
(A) Change in
(deg) Change in
(deg) Angle of psi(i) axis to hinge axis
(deg) Angle of psi(i) axis to hinge axis
(deg) Percentage Progress
THR-136
PHE-137
10.0
10.8
24.6
-9.0
79.1
66.7
-68.8
PHE-137
UNK-138
12.9
13.6
8.0
-13.8
57.0
78.1
25.3
UNK-138
GLU-139
14.1
15.1
4.9
-7.8
64.2
74.7
21.9
GLU-139
ALA-140
16.5
18.0
-37.5
32.1
176.7
162.9
-41.9
ALA-140
GLY-141
15.4
16.7
-37.7
-18.0
102.7
101.2
-107.9

Graph shows rotational transition at bending residues and can be used
to identify hinge bending residues.
Probably only informative for interdomain rotations greater than 20 degrees
Residue
iResidue
i+1Distance of hinge axis to residue i in
(A) Distance of hinge axis to residue i in
(A) Change in
(deg) Change in
(deg) Angle of psi(i) axis to hinge axis
(deg) Angle of psi(i) axis to hinge axis
(deg) Percentage Progress
ILE-187
UNK-188
7.4
8.1
17.4
-19.2
102.9
103.2
-10.3
UNK-188
ASP-189
9.1
9.4
4.7
-25.4
141.6
136.9
129.0
ASP-189
SER-190
10.0
9.6
18.5
10.3
80.7
76.6
71.3

Graph shows rotational transition at bending residues and can be used
to identify hinge bending residues.
Probably only informative for interdomain rotations greater than 20 degrees
Residue
iResidue
i+1Distance of hinge axis to residue i in
(A) Distance of hinge axis to residue i in
(A) Change in
(deg) Change in
(deg) Angle of psi(i) axis to hinge axis
(deg) Angle of psi(i) axis to hinge axis
(deg) Percentage Progress
HIS-191
GLY-192
6.3
7.4
15.5
0.1
25.7
24.2
95.7
GLY-192
ILE-193
5.5
6.2
66.6
-54.4
61.0
62.6
29.0
ILE-193
LEU-194
7.8
8.8
-2.2
-8.3
68.6
61.0
123.1
LEU-194
UNK-195
7.9
8.6
-10.3
0.3
66.8
66.2
-17.2
LEU-194
UNK-195
7.9
8.6
-10.3
0.3
66.8
66.2
-17.2

Graph shows rotational transition at bending residues and can be used
to identify hinge bending residues.
Probably only informative for interdomain rotations greater than 20 degrees
Residue
iResidue
i+1Distance of hinge axis to residue i in
(A) Distance of hinge axis to residue i in
(A) Change in
(deg) Change in
(deg) Angle of psi(i) axis to hinge axis
(deg) Angle of psi(i) axis to hinge axis
(deg) Percentage Progress
LEU-194
UNK-195
7.9
8.6
-10.3
0.3
66.8
66.2
-17.2
LEU-194
UNK-195
7.9
8.6
-10.3
0.3
66.8
66.2
-17.2
UNK-195
UNK-196
4.8
5.3
-11.9
-2.5
11.6
6.7
96.2
UNK-196
VAL-197
4.3
4.8
8.3
-26.3
107.7
113.4
6.0

Graph shows rotational transition at bending residues and can be used
to identify hinge bending residues.
Probably only informative for interdomain rotations greater than 20 degrees
Residue
iResidue
i+1Distance of hinge axis to residue i in
(A) Distance of hinge axis to residue i in
(A) Change in
(deg) Change in
(deg) Angle of psi(i) axis to hinge axis
(deg) Angle of psi(i) axis to hinge axis
(deg) Percentage Progress
ALA-429
ILE-430
11.8
12.2
-6.1
17.1
138.1
133.0
37.1
ILE-430
ASP-431
8.6
8.9
-13.3
21.3
69.2
71.3
-25.5
ASP-431
GLY-432
7.7
7.9
-28.4
3.5
25.7
20.0
153.0
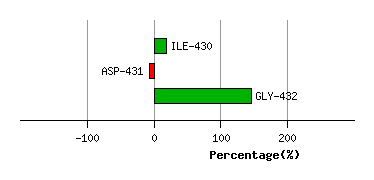
Graph shows rotational transition at bending residues and can be used
to identify hinge bending residues.
Probably only informative for interdomain rotations greater than 20 degrees
Residue
iResidue
i+1Distance of hinge axis to residue i in
(A) Distance of hinge axis to residue i in
(A) Change in
(deg) Change in
(deg) Angle of psi(i) axis to hinge axis
(deg) Angle of psi(i) axis to hinge axis
(deg) Percentage Progress
UNK-433
GLY-434
8.9
9.4
1.0
-17.3
118.3
111.0
104.3
GLY-434
ALA-435
6.7
7.6
60.7
-20.3
82.2
96.4
53.4
ALA-435
ALA-436
3.0
4.1
-10.8
-0.5
157.2
147.3
-65.4

Graph shows rotational transition at bending residues and can be used
to identify hinge bending residues.
Probably only informative for interdomain rotations greater than 20 degrees
Residue
iResidue
i+1Distance of hinge axis to residue i in
(A) Distance of hinge axis to residue i in
(A) Change in
(deg) Change in
(deg) Angle of psi(i) axis to hinge axis
(deg) Angle of psi(i) axis to hinge axis
(deg) Percentage Progress
VAL-439
ILE-440
2.0
1.8
18.3
-8.9
163.6
174.3
-100.1
ILE-440
UNK-441
2.4
1.7
4.3
-22.9
96.9
110.1
80.4
UNK-441
SER-442
6.0
5.3
-1.9
4.5
96.5
102.8
-13.9
SER-442
ILE-443
7.1
6.2
19.6
-35.8
144.1
135.6
73.9

Graph shows rotational transition at bending residues and can be used
to identify hinge bending residues.
Probably only informative for interdomain rotations greater than 20 degrees