Acriflavine Resistance Protein B
(All numbering and residues are taken from first PDB file)
![]()
![]()
Bending Residue Dihedral Analysis
Residue
iResidue
i+1Distance of hinge axis to residue i in
(A) Distance of hinge axis to residue i in
(A) Change in
(deg) Change in
(deg) Angle of psi(i) axis to hinge axis
(deg) Angle of psi(i) axis to hinge axis
(deg) Percentage Progress
GLN-34
TYR-35
21.1
19.8
0.7
-3.9
64.5
62.9
-13.3
TYR-35
PRO-36
19.2
18.6
10.4
7.0
56.0
61.6
35.7
PRO-36
THR-37
16.5
16.0
-63.9
21.2
52.4
49.7
162.3

Graph shows rotational transition at bending residues and can be used
to identify hinge bending residues.
Probably only informative for interdomain rotations greater than 20 degrees
Residue
iResidue
i+1Distance of hinge axis to residue i in
(A) Distance of hinge axis to residue i in
(A) Change in
(deg) Change in
(deg) Angle of psi(i) axis to hinge axis
(deg) Angle of psi(i) axis to hinge axis
(deg) Percentage Progress
SER-133
SER-134
6.8
6.8
-0.1
9.2
169.5
170.4
39.6
SER-134
SER-135
8.4
7.1
8.4
3.3
68.2
63.2
21.4
SER-135
PHE-136
11.1
10.1
-2.3
10.5
71.2
68.1
23.4

Graph shows rotational transition at bending residues and can be used
to identify hinge bending residues.
Probably only informative for interdomain rotations greater than 20 degrees
Residue
iResidue
i+1Distance of hinge axis to residue i in
(A) Distance of hinge axis to residue i in
(A) Change in
(deg) Change in
(deg) Angle of psi(i) axis to hinge axis
(deg) Angle of psi(i) axis to hinge axis
(deg) Percentage Progress
VAL-576
GLN-577
13.2
12.7
-7.9
9.9
77.7
77.9
-22.3
GLN-577
LEU-578
10.6
10.1
4.5
-9.2
169.5
171.0
31.7
LEU-578
PRO-579
9.6
8.9
3.9
-11.8
106.7
95.9
29.7
PRO-579
ALA-580
8.4
7.3
-8.3
-3.9
94.7
96.2
18.5
ALA-580
GLY-581
5.4
3.9
9.7
11.9
133.0
156.6
-63.4
GLY-581
ALA-582
2.4
1.6
-4.0
-14.0
79.8
75.3
25.7

Graph shows rotational transition at bending residues and can be used
to identify hinge bending residues.
Probably only informative for interdomain rotations greater than 20 degrees
Residue
iResidue
i+1Distance of hinge axis to residue i in
(A) Distance of hinge axis to residue i in
(A) Change in
(deg) Change in
(deg) Angle of psi(i) axis to hinge axis
(deg) Angle of psi(i) axis to hinge axis
(deg) Percentage Progress
ASN-613
GLY-614
12.2
11.9
2.9
9.4
71.7
74.5
10.6
GLY-614
PHE-615
8.6
8.4
-13.6
26.3
157.2
151.8
65.8
PHE-615
GLY-616
8.3
7.8
-7.2
25.9
96.2
96.0
39.1

Graph shows rotational transition at bending residues and can be used
to identify hinge bending residues.
Probably only informative for interdomain rotations greater than 20 degrees
Residue
iResidue
i+1Distance of hinge axis to residue i in
(A) Distance of hinge axis to residue i in
(A) Change in
(deg) Change in
(deg) Angle of psi(i) axis to hinge axis
(deg) Angle of psi(i) axis to hinge axis
(deg) Percentage Progress
ARG-620
GLY-621
3.6
3.8
-5.5
31.1
159.1
156.5
127.9
GLY-621
GLN-622
3.5
3.6
14.0
-17.2
54.2
51.0
-17.2
GLN-622
ASN-623
5.9
5.7
-10.3
17.6
103.2
105.0
-38.2
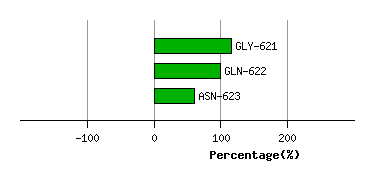
Graph shows rotational transition at bending residues and can be used
to identify hinge bending residues.
Probably only informative for interdomain rotations greater than 20 degrees
Residue
iResidue
i+1Distance of hinge axis to residue i in
(A) Distance of hinge axis to residue i in
(A) Change in
(deg) Change in
(deg) Angle of psi(i) axis to hinge axis
(deg) Angle of psi(i) axis to hinge axis
(deg) Percentage Progress
ASN-667
LEU-668
22.1
21.8
-35.6
41.3
120.9
127.3
35.4
LEU-668
PRO-669
19.5
19.0
-10.6
21.1
124.2
118.8
3.8
PRO-669
ALA-670
19.0
19.1
165.3
118.7
25.2
40.7
-364.0
ALA-670
ILE-671
20.3
20.6
68.3
-23.0
54.5
39.8
215.8
ILE-671
VAL-672
16.8
20.0
-172.3
-106.5
48.3
109.7
-126.3
VAL-672
GLU-673
14.6
16.8
-119.7
-38.6
95.5
41.0
211.5
GLU-673
LEU-674
11.4
15.3
94.5
-73.3
123.7
104.9
-142.9
LEU-674
GLY-675
11.9
18.7
26.4
73.5
158.5
104.6
-340.5
GLY-675
THR-676
13.5
19.8
168.0
42.3
110.9
159.5
737.9
THR-676
ALA-677
13.7
19.8
-11.6
-163.3
63.7
94.7
60.9
ALA-677
THR-678
17.2
22.3
49.8
77.4
67.5
132.7
-60.6
THR-678
GLY-679
20.7
24.5
54.6
-57.4
124.6
120.5
0.9
GLY-679
PHE-680
22.1
22.7
-19.3
-50.0
116.3
116.9
-132.9
PHE-680
ASP-681
21.1
21.4
-17.4
23.1
71.6
68.0
12.6

Graph shows rotational transition at bending residues and can be used
to identify hinge bending residues.
Probably only informative for interdomain rotations greater than 20 degrees
Residue
iResidue
i+1Distance of hinge axis to residue i in
(A) Distance of hinge axis to residue i in
(A) Change in
(deg) Change in
(deg) Angle of psi(i) axis to hinge axis
(deg) Angle of psi(i) axis to hinge axis
(deg) Percentage Progress
THR-724
PRO-725
6.3
6.6
3.4
22.7
53.7
60.8
99.1
PRO-725
GLN-726
6.5
6.9
1.8
-10.2
109.7
122.1
38.6
GLN-726
PHE-727
7.9
8.7
8.3
-2.1
42.9
46.7
23.8

Graph shows rotational transition at bending residues and can be used
to identify hinge bending residues.
Probably only informative for interdomain rotations greater than 20 degrees
Residue
iResidue
i+1Distance of hinge axis to residue i in
(A) Distance of hinge axis to residue i in
(A) Change in
(deg) Change in
(deg) Angle of psi(i) axis to hinge axis
(deg) Angle of psi(i) axis to hinge axis
(deg) Percentage Progress
GLU-810
TYR-811
11.7
12.1
-16.4
27.2
119.8
128.9
-1.3
TYR-811
GLY-812
10.9
11.1
-0.3
8.0
160.7
156.3
41.5
GLY-812
SER-813
10.9
11.0
0.9
-4.1
55.2
51.7
-6.4
SER-813
PRO-814
9.5
9.4
17.3
-15.3
67.3
70.1
31.7
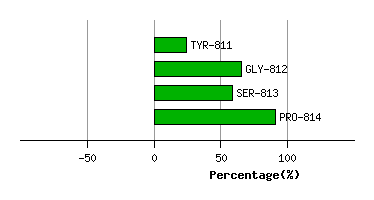
Graph shows rotational transition at bending residues and can be used
to identify hinge bending residues.
Probably only informative for interdomain rotations greater than 20 degrees
Residue
iResidue
i+1Distance of hinge axis to residue i in
(A) Distance of hinge axis to residue i in
(A) Change in
(deg) Change in
(deg) Angle of psi(i) axis to hinge axis
(deg) Angle of psi(i) axis to hinge axis
(deg) Percentage Progress
GLN-865
GLU-866
20.3
20.7
-29.8
26.8
93.4
100.6
7.5
GLU-866
ARG-867
23.6
23.9
-5.6
23.6
82.5
80.5
-10.5
ARG-867
LEU-868
25.1
25.1
-10.7
-60.4
14.4
28.8
343.9
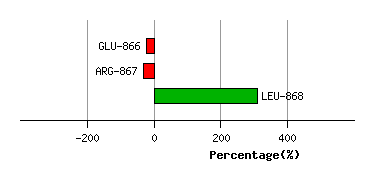
Graph shows rotational transition at bending residues and can be used
to identify hinge bending residues.
Probably only informative for interdomain rotations greater than 20 degrees