2,4-D Inducible Glutathione S-Transferase
(All numbering and residues are taken from first PDB file)
![]()
![]()
Bending Residue Dihedral Analysis
Residue
iResidue
i+1Distance of hinge axis to residue i in
(A) Distance of hinge axis to residue i in
(A) Change in
(deg) Change in
(deg) Angle of psi(i) axis to hinge axis
(deg) Angle of psi(i) axis to hinge axis
(deg) Percentage Progress
TRP-98
ALA-99
5.3
5.4
-1.6
-3.2
84.0
80.0
33.2
ALA-99
ASP-100
4.5
4.5
5.6
-1.8
110.3
106.3
-70.2
ASP-100
TYR-101
8.2
8.3
5.0
-7.9
166.8
166.9
58.1
TYR-101
VAL-102
7.8
7.8
4.0
7.0
127.9
126.2
-80.9
VAL-102
ASP-103
5.7
5.8
-1.6
10.1
88.9
84.8
-102.8
ASP-103
LYS-104
8.8
9.4
-5.6
11.0
62.1
50.3
-32.5
LYS-104
LYS-105
11.2
11.2
-14.7
7.7
10.0
12.9
53.7
LYS-105
ILE-106
9.5
9.2
1.9
-4.3
126.4
118.8
70.1
ILE-106
TYR-107
7.1
7.3
-7.9
1.4
70.3
71.7
156.0
TYR-107
ASP-108
10.2
10.4
12.4
-11.6
130.1
135.7
-19.1
ASP-108
LEU-109
12.5
12.6
-4.2
3.8
31.4
27.5
-27.0
LEU-109
GLY-110
10.2
10.3
-0.8
13.7
52.7
63.7
-123.7
GLY-110
ARG-111
9.2
9.5
-13.7
-10.2
61.3
57.5
355.3
ARG-111
LYS-112
12.9
13.2
14.0
-0.4
134.9
140.0
-230.1

Graph shows rotational transition at bending residues and can be used
to identify hinge bending residues.
Probably only informative for interdomain rotations greater than 20 degrees
Residue
iResidue
i+1Distance of hinge axis to residue i in
(A) Distance of hinge axis to residue i in
(A) Change in
(deg) Change in
(deg) Angle of psi(i) axis to hinge axis
(deg) Angle of psi(i) axis to hinge axis
(deg) Percentage Progress
ILE-129
GLU-130
4.1
4.0
10.3
3.5
128.7
123.8
-116.1
GLU-130
ALA-131
7.4
7.3
-9.4
0.3
15.6
15.5
103.9
ALA-131
LEU-132
5.9
6.0
6.0
-4.6
102.3
101.8
35.2

Graph shows rotational transition at bending residues and can be used
to identify hinge bending residues.
Probably only informative for interdomain rotations greater than 20 degrees
Residue
iResidue
i+1Distance of hinge axis to residue i in
(A) Distance of hinge axis to residue i in
(A) Change in
(deg) Change in
(deg) Angle of psi(i) axis to hinge axis
(deg) Angle of psi(i) axis to hinge axis
(deg) Percentage Progress
TYR-167
GLU-168
7.9
8.1
-8.1
-2.2
33.4
29.1
164.5
GLU-168
THR-169
6.4
6.7
-0.6
5.5
31.3
32.2
-88.1
THR-169
PHE-170
9.2
9.6
28.9
-20.8
101.0
109.7
-161.6
PHE-170
GLY-171
10.8
10.5
1.2
14.0
89.4
93.6
49.8
GLY-171
THR-172
8.1
7.4
-12.6
-7.2
51.9
40.3
64.0
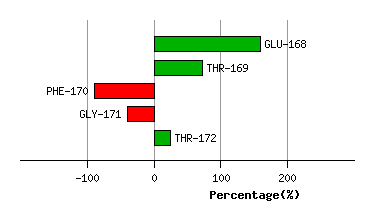
Graph shows rotational transition at bending residues and can be used
to identify hinge bending residues.
Probably only informative for interdomain rotations greater than 20 degrees
Residue
iResidue
i+1Distance of hinge axis to residue i in
(A) Distance of hinge axis to residue i in
(A) Change in
(deg) Change in
(deg) Angle of psi(i) axis to hinge axis
(deg) Angle of psi(i) axis to hinge axis
(deg) Percentage Progress
GLU-178
CYS-179
5.8
6.1
18.5
-0.4
160.8
163.3
-175.4
CYS-179
PRO-180
6.2
6.5
6.1
8.0
109.2
102.6
-116.2
PRO-180
LYS-181
9.3
9.5
-17.3
6.1
11.2
9.5
160.6

Graph shows rotational transition at bending residues and can be used
to identify hinge bending residues.
Probably only informative for interdomain rotations greater than 20 degrees