Class B Acid Phosphatase
(All numbering and residues are taken from first PDB file)
![]()
![]()
Bending Residue Dihedral Analysis
Residue
iResidue
i+1Distance of hinge axis to residue i in
(A) Distance of hinge axis to residue i in
(A) Change in
(deg) Change in
(deg) Angle of psi(i) axis to hinge axis
(deg) Angle of psi(i) axis to hinge axis
(deg) Percentage Progress
SER-32
LEU-33
7.6
7.4
-0.6
2.6
70.8
72.3
48.2
LEU-33
ALA-34
4.3
4.2
-0.7
-2.9
57.7
56.2
52.0
ALA-34
GLY-35
6.9
6.8
0.1
-1.4
146.5
147.2
71.3

Graph shows rotational transition at bending residues and can be used
to identify hinge bending residues.
Probably only informative for interdomain rotations greater than 20 degrees
Residue
iResidue
i+1Distance of hinge axis to residue i in
(A) Distance of hinge axis to residue i in
(A) Change in
(deg) Change in
(deg) Angle of psi(i) axis to hinge axis
(deg) Angle of psi(i) axis to hinge axis
(deg) Percentage Progress
ARG-36
PRO-37
2.9
2.9
5.9
4.8
111.0
113.0
-77.6
PRO-37
PRO-38
5.8
5.5
-4.0
-0.9
28.8
22.1
335.4
PRO-38
MET-39
7.0
6.8
-2.2
5.5
90.9
88.4
-83.4

Graph shows rotational transition at bending residues and can be used
to identify hinge bending residues.
Probably only informative for interdomain rotations greater than 20 degrees
Residue
iResidue
i+1Distance of hinge axis to residue i in
(A) Distance of hinge axis to residue i in
(A) Change in
(deg) Change in
(deg) Angle of psi(i) axis to hinge axis
(deg) Angle of psi(i) axis to hinge axis
(deg) Percentage Progress
PHE-56
TRP-57
9.1
9.1
-2.1
-6.1
147.6
149.1
-257.8
TRP-57
ARG-58
8.6
8.7
4.7
-1.3
41.0
40.8
140.5
ARG-58
GLY-59
8.1
8.1
2.7
-0.6
92.4
93.2
117.1
GLY-59
LYS-60
11.5
11.5
2.0
2.7
69.0
69.5
88.0
LYS-60
LYS-61
13.2
13.2
2.6
-5.1
1.9
3.6
-142.5

Graph shows rotational transition at bending residues and can be used
to identify hinge bending residues.
Probably only informative for interdomain rotations greater than 20 degrees
Residue
iResidue
i+1Distance of hinge axis to residue i in
(A) Distance of hinge axis to residue i in
(A) Change in
(deg) Change in
(deg) Angle of psi(i) axis to hinge axis
(deg) Angle of psi(i) axis to hinge axis
(deg) Percentage Progress
TRP-84
ASP-85
8.3
8.4
3.9
-0.6
49.5
47.9
62.5
ASP-85
GLU-86
6.7
6.7
1.3
0.0
100.5
101.2
20.8
GLU-86
PHE-87
7.4
7.3
-0.8
1.4
71.3
70.7
-23.8

Graph shows rotational transition at bending residues and can be used
to identify hinge bending residues.
Probably only informative for interdomain rotations greater than 20 degrees
Residue
iResidue
i+1Distance of hinge axis to residue i in
(A) Distance of hinge axis to residue i in
(A) Change in
(deg) Change in
(deg) Angle of psi(i) axis to hinge axis
(deg) Angle of psi(i) axis to hinge axis
(deg) Percentage Progress
GLU-92
VAL-93
7.5
7.5
-3.0
-0.7
20.9
19.7
156.0
VAL-93
ALA-94
6.6
6.6
-2.9
2.0
66.4
67.0
-8.0
ALA-94
ARG-95
3.3
3.3
4.1
-2.4
103.2
100.8
65.9

Graph shows rotational transition at bending residues and can be used
to identify hinge bending residues.
Probably only informative for interdomain rotations greater than 20 degrees
Residue
iResidue
i+1Distance of hinge axis to residue i in
(A) Distance of hinge axis to residue i in
(A) Change in
(deg) Change in
(deg) Angle of psi(i) axis to hinge axis
(deg) Angle of psi(i) axis to hinge axis
(deg) Percentage Progress
ARG-162
ILE-163
6.9
6.9
-6.5
3.5
61.9
61.2
-5.1
ILE-163
PHE-164
5.5
5.5
0.6
-0.6
158.1
158.2
48.6
PHE-164
TYR-165
6.9
6.9
0.3
-2.5
126.3
125.8
35.7
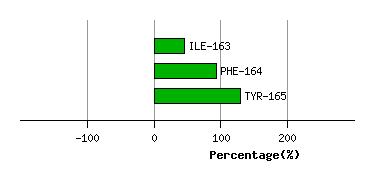
Graph shows rotational transition at bending residues and can be used
to identify hinge bending residues.
Probably only informative for interdomain rotations greater than 20 degrees
Residue
iResidue
i+1Distance of hinge axis to residue i in
(A) Distance of hinge axis to residue i in
(A) Change in
(deg) Change in
(deg) Angle of psi(i) axis to hinge axis
(deg) Angle of psi(i) axis to hinge axis
(deg) Percentage Progress
ASN-170
ASP-171
16.0
15.9
-1.4
2.3
59.2
57.7
-164.4
ASP-171
ILE-172
12.4
12.3
-0.4
-3.1
24.9
26.4
76.4
ILE-172
THR-173
13.3
13.3
-3.6
2.8
55.5
55.1
3.2
THR-173
ALA-174
16.5
16.5
1.4
-1.1
106.9
107.3
80.3

Graph shows rotational transition at bending residues and can be used
to identify hinge bending residues.
Probably only informative for interdomain rotations greater than 20 degrees
Residue
iResidue
i+1Distance of hinge axis to residue i in
(A) Distance of hinge axis to residue i in
(A) Change in
(deg) Change in
(deg) Angle of psi(i) axis to hinge axis
(deg) Angle of psi(i) axis to hinge axis
(deg) Percentage Progress
GLY-179
ALA-180
13.6
13.6
-9.6
2.1
81.2
79.4
-51.9
ALA-180
ARG-181
10.3
10.4
-1.9
2.0
74.5
75.1
-71.2
ARG-181
GLY-182
8.9
8.9
-0.6
0.4
3.0
3.1
13.6

Graph shows rotational transition at bending residues and can be used
to identify hinge bending residues.
Probably only informative for interdomain rotations greater than 20 degrees