Aspartyl Trna Synthetase
(All numbering and residues are taken from first PDB file)
![]()
![]()
Bending Residue Dihedral Analysis
Residue
iResidue
i+1Distance of hinge axis to residue i in
(A) Distance of hinge axis to residue i in
(A) Change in
(deg) Change in
(deg) Angle of psi(i) axis to hinge axis
(deg) Angle of psi(i) axis to hinge axis
(deg) Percentage Progress
ASP-285
LEU-286
2.3
2.2
-1.2
0.0
116.4
117.9
4.6
LEU-286
ARG-287
4.1
4.1
10.7
-8.3
30.7
27.1
45.1
ARG-287
ASN-288
2.0
2.0
-17.3
17.1
76.9
76.7
66.3

Graph shows rotational transition at bending residues and can be used
to identify hinge bending residues.
Probably only informative for interdomain rotations greater than 20 degrees
Residue
iResidue
i+1Distance of hinge axis to residue i in
(A) Distance of hinge axis to residue i in
(A) Change in
(deg) Change in
(deg) Angle of psi(i) axis to hinge axis
(deg) Angle of psi(i) axis to hinge axis
(deg) Percentage Progress
PHE-307
ALA-308
16.6
16.6
-1.3
15.5
132.6
136.4
273.2
ALA-308
GLY-309
17.5
17.4
-26.3
10.3
124.0
113.8
-207.2
GLY-309
PRO-310
14.3
14.0
-12.0
16.8
62.9
53.9
-89.5
PRO-310
ALA-311
11.9
11.7
1.7
2.2
73.8
73.9
-14.5
PRO-310
ALA-311
11.9
11.7
1.7
2.2
73.8
73.9
-14.5

Graph shows rotational transition at bending residues and can be used
to identify hinge bending residues.
Probably only informative for interdomain rotations greater than 20 degrees
Residue
iResidue
i+1Distance of hinge axis to residue i in
(A) Distance of hinge axis to residue i in
(A) Change in
(deg) Change in
(deg) Angle of psi(i) axis to hinge axis
(deg) Angle of psi(i) axis to hinge axis
(deg) Percentage Progress
PRO-310
ALA-311
11.9
11.7
1.7
2.2
73.8
73.9
-14.5
PRO-310
ALA-311
11.9
11.7
1.7
2.2
73.8
73.9
-14.5
ALA-311
ASN-312
14.6
14.6
-30.1
30.3
42.8
51.3
-77.2
ASN-312
ASP-313
15.1
15.3
-37.8
34.1
61.2
70.5
88.4
ASP-313
PRO-314
11.5
11.7
-9.9
-3.3
120.2
129.8
-171.9
PRO-314
LYS-315
10.8
11.3
21.0
-4.7
59.7
72.5
139.0
LYS-315
GLY-316
7.1
7.5
-0.7
-30.9
134.7
138.2
-456.8
GLY-316
ARG-317
8.4
8.0
14.4
-6.4
28.3
40.5
148.2

Graph shows rotational transition at bending residues and can be used
to identify hinge bending residues.
Probably only informative for interdomain rotations greater than 20 degrees
Residue
iResidue
i+1Distance of hinge axis to residue i in
(A) Distance of hinge axis to residue i in
(A) Change in
(deg) Change in
(deg) Angle of psi(i) axis to hinge axis
(deg) Angle of psi(i) axis to hinge axis
(deg) Percentage Progress
ALA-319
ALA-320
11.1
11.1
7.2
-12.0
51.3
51.2
-33.4
ALA-320
LEU-321
13.2
13.1
-11.2
18.3
148.2
152.6
196.8
LEU-321
ARG-322
11.8
11.6
12.9
-19.2
44.7
48.6
-93.3
ARG-322
VAL-323
13.9
13.7
-7.6
1.0
139.7
147.1
-91.9
VAL-323
PRO-324
13.3
13.3
-6.8
5.2
137.7
137.6
-77.3

Graph shows rotational transition at bending residues and can be used
to identify hinge bending residues.
Probably only informative for interdomain rotations greater than 20 degrees
Residue
iResidue
i+1Distance of hinge axis to residue i in
(A) Distance of hinge axis to residue i in
(A) Change in
(deg) Change in
(deg) Angle of psi(i) axis to hinge axis
(deg) Angle of psi(i) axis to hinge axis
(deg) Percentage Progress
ALA-403
ASP-404
2.8
2.8
12.6
-9.1
114.6
111.7
-70.3
ASP-404
ALA-405
3.4
3.4
-14.9
6.7
62.9
62.5
85.4
ALA-405
MET-406
6.8
6.9
18.0
-9.0
146.9
140.0
-163.3
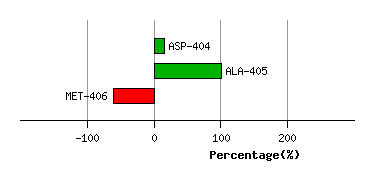
Graph shows rotational transition at bending residues and can be used
to identify hinge bending residues.
Probably only informative for interdomain rotations greater than 20 degrees
Residue
iResidue
i+1Distance of hinge axis to residue i in
(A) Distance of hinge axis to residue i in
(A) Change in
(deg) Change in
(deg) Angle of psi(i) axis to hinge axis
(deg) Angle of psi(i) axis to hinge axis
(deg) Percentage Progress
ARG-410
LEU-411
6.5
6.5
-19.1
17.1
140.5
141.3
-59.3
LEU-411
LYS-412
5.5
5.1
-1.2
3.8
111.3
111.8
-5.1
LYS-412
VAL-413
9.3
8.9
-8.0
13.1
124.1
126.3
45.0
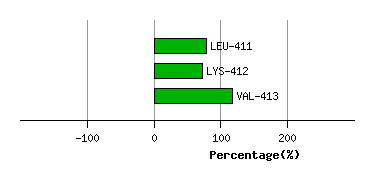
Graph shows rotational transition at bending residues and can be used
to identify hinge bending residues.
Probably only informative for interdomain rotations greater than 20 degrees
Residue
iResidue
i+1Distance of hinge axis to residue i in
(A) Distance of hinge axis to residue i in
(A) Change in
(deg) Change in
(deg) Angle of psi(i) axis to hinge axis
(deg) Angle of psi(i) axis to hinge axis
(deg) Percentage Progress
ASP-421
GLU-422
3.0
2.7
-17.1
25.6
86.3
88.2
-126.3
GLU-422
SER-423
2.9
3.3
-17.5
-0.6
28.8
39.8
241.3
SER-423
LYS-424
1.3
2.2
-29.4
51.2
97.9
101.5
100.7
LYS-424
TRP-425
3.1
3.2
-1.7
-10.0
141.2
138.4
-179.8
TRP-425
ALA-426
6.0
6.2
-11.0
12.2
132.3
128.3
84.2
ALA-426
PRO-427
6.6
6.5
-1.1
0.2
130.0
130.9
-42.8

Graph shows rotational transition at bending residues and can be used
to identify hinge bending residues.
Probably only informative for interdomain rotations greater than 20 degrees