Dihydrodipicolinate Synthase
(All numbering and residues are taken from first PDB file)
![]()
![]()
Bending Residue Dihedral Analysis
Residue
iResidue
i+1Distance of hinge axis to residue i in
(A) Distance of hinge axis to residue i in
(A) Change in
(deg) Change in
(deg) Angle of psi(i) axis to hinge axis
(deg) Angle of psi(i) axis to hinge axis
(deg) Percentage Progress
GLU-50
SER-51
6.9
7.0
2.5
-3.7
56.2
57.5
-45.3
SER-51
ALA-52
10.4
10.5
4.9
-3.9
7.1
8.9
46.6
ALA-52
THR-53
9.1
9.1
-4.2
3.1
117.1
116.1
-68.4

Graph shows rotational transition at bending residues and can be used
to identify hinge bending residues.
Probably only informative for interdomain rotations greater than 20 degrees
Residue
iResidue
i+1Distance of hinge axis to residue i in
(A) Distance of hinge axis to residue i in
(A) Change in
(deg) Change in
(deg) Angle of psi(i) axis to hinge axis
(deg) Angle of psi(i) axis to hinge axis
(deg) Percentage Progress
LEU-54
THR-55
11.5
11.4
-2.6
1.7
46.3
46.9
-41.9
THR-55
HIS-56
14.6
14.5
-2.9
8.5
117.9
120.5
144.8
HIS-56
GLU-57
17.8
17.6
-3.6
0.7
130.0
130.4
-78.7
GLU-57
GLU-58
19.4
19.3
3.8
-3.9
33.1
32.8
-27.2
GLU-58
HIS-59
16.6
16.4
1.1
-3.2
54.8
51.8
61.5
GLU-58
HIS-59
16.6
16.4
1.1
-3.2
54.8
51.8
61.5

Graph shows rotational transition at bending residues and can be used
to identify hinge bending residues.
Probably only informative for interdomain rotations greater than 20 degrees
Residue
iResidue
i+1Distance of hinge axis to residue i in
(A) Distance of hinge axis to residue i in
(A) Change in
(deg) Change in
(deg) Angle of psi(i) axis to hinge axis
(deg) Angle of psi(i) axis to hinge axis
(deg) Percentage Progress
GLU-58
HIS-59
16.6
16.4
1.1
-3.2
54.8
51.8
61.5
GLU-58
HIS-59
16.6
16.4
1.1
-3.2
54.8
51.8
61.5
HIS-59
ARG-60
16.6
16.6
0.8
1.7
56.5
56.6
-12.6
ARG-60
THR-61
20.2
20.2
-2.2
1.0
139.7
136.6
-23.4
THR-61
CYS-62
19.6
19.5
-0.2
0.0
142.1
142.4
52.9
CYS-62
ILE-63
16.7
16.6
3.8
-4.6
57.1
55.3
-48.5
ILE-63
GLU-64
19.0
18.9
1.5
-1.6
57.6
58.2
15.6
GLU-64
ILE-65
21.7
21.7
2.8
-2.4
35.8
37.0
18.3

Graph shows rotational transition at bending residues and can be used
to identify hinge bending residues.
Probably only informative for interdomain rotations greater than 20 degrees
Residue
iResidue
i+1Distance of hinge axis to residue i in
(A) Distance of hinge axis to residue i in
(A) Change in
(deg) Change in
(deg) Angle of psi(i) axis to hinge axis
(deg) Angle of psi(i) axis to hinge axis
(deg) Percentage Progress
LYS-245
ILE-246
11.8
11.6
5.6
0.0
53.3
56.2
155.8
ILE-246
LEU-247
10.1
10.0
-0.9
1.4
119.2
121.0
90.7
LEU-247
PHE-248
6.8
6.8
1.5
-2.3
30.3
29.5
-13.0

Graph shows rotational transition at bending residues and can be used
to identify hinge bending residues.
Probably only informative for interdomain rotations greater than 20 degrees
Residue
iResidue
i+1Distance of hinge axis to residue i in
(A) Distance of hinge axis to residue i in
(A) Change in
(deg) Change in
(deg) Angle of psi(i) axis to hinge axis
(deg) Angle of psi(i) axis to hinge axis
(deg) Percentage Progress
ILE-254
PRO-255
2.7
2.6
0.2
1.5
26.2
27.9
67.6
PRO-255
ILE-256
4.4
4.4
0.8
1.6
46.8
46.6
40.2
ILE-256
LYS-257
1.3
1.3
-3.2
0.7
81.5
82.8
-29.4

Graph shows rotational transition at bending residues and can be used
to identify hinge bending residues.
Probably only informative for interdomain rotations greater than 20 degrees
Residue
iResidue
i+1Distance of hinge axis to residue i in
(A) Distance of hinge axis to residue i in
(A) Change in
(deg) Change in
(deg) Angle of psi(i) axis to hinge axis
(deg) Angle of psi(i) axis to hinge axis
(deg) Percentage Progress
GLY-264
LEU-265
10.7
10.6
0.0
-3.3
91.9
92.4
87.7
LEU-265
ILE-266
8.9
8.9
-2.5
7.4
150.1
149.9
136.2
ILE-266
GLU-267
10.1
10.0
-1.0
2.0
106.2
107.2
99.9

Graph shows rotational transition at bending residues and can be used
to identify hinge bending residues.
Probably only informative for interdomain rotations greater than 20 degrees
Residue
iResidue
i+1Distance of hinge axis to residue i in
(A) Distance of hinge axis to residue i in
(A) Change in
(deg) Change in
(deg) Angle of psi(i) axis to hinge axis
(deg) Angle of psi(i) axis to hinge axis
(deg) Percentage Progress
LYS-280
GLU-281
14.8
14.6
10.1
-2.3
43.7
45.9
348.6
GLU-281
ASN-282
15.8
15.7
-3.0
1.3
125.3
125.2
29.2
ASN-282
PHE-283
12.4
12.4
1.4
0.1
57.1
55.7
-48.5
PHE-283
ALA-284
11.3
11.3
1.3
-3.3
29.3
29.8
-22.1
ALA-284
LYS-285
14.2
14.2
2.1
-0.5
50.3
54.5
87.3
LYS-285
ILE-286
13.4
13.5
-2.0
2.9
119.1
121.3
27.4
ILE-286
GLU-287
9.7
9.8
-1.1
-1.6
136.3
139.6
-212.1
GLU-287
GLU-288
11.2
11.1
3.1
6.7
31.4
37.4
524.9
GLU-288
VAL-289
13.2
13.3
-0.1
-3.9
121.4
122.1
-123.8
LYS-291
LYS-292
10.3
10.7
-15.5
11.2
143.3
144.9
-183.3
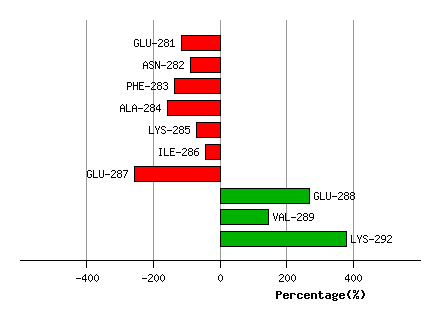
Graph shows rotational transition at bending residues and can be used
to identify hinge bending residues.
Probably only informative for interdomain rotations greater than 20 degrees